Fig. 9
Download original image
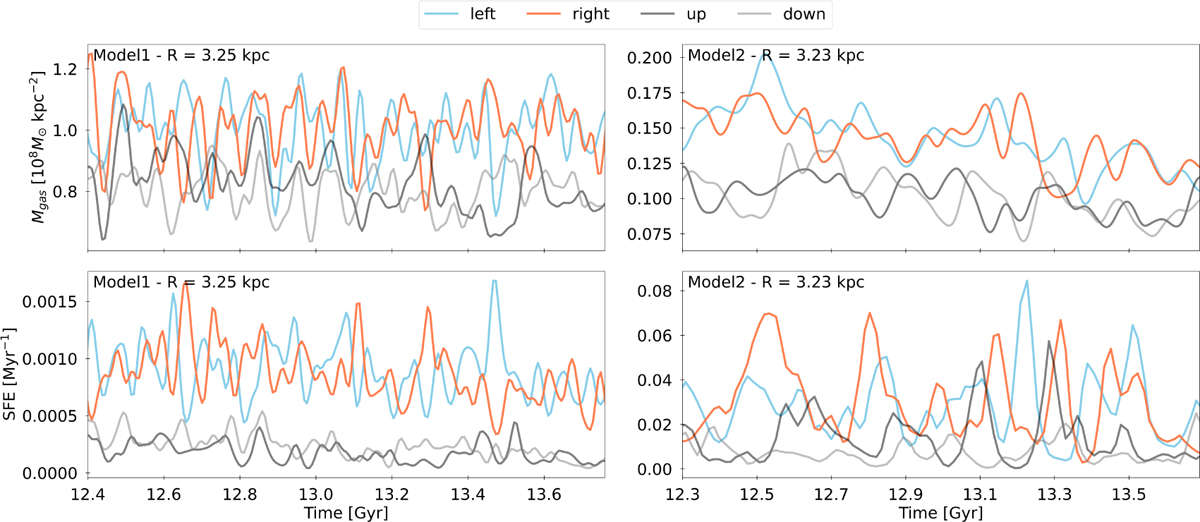
Mass of gas (top panel) and star formation efficiency (bottom panel) across time in Model1 and Model2 from left to right, for the four regions used in Figs. 8 and 10. There is slightly less gas along the minor axis of the bar compared to its major axis, which partially explains the lower number of newly born stars in the former. However, the main reason for the higher number of newly born stars at the bar major axis is the much higher SFE, as seen in the bottom panel. The time evolution of SFE at the two sides of the bar (blue and orange) often anticorrelates, which suggests the presence of a nonbisymmetric spiral structure.
Current usage metrics show cumulative count of Article Views (full-text article views including HTML views, PDF and ePub downloads, according to the available data) and Abstracts Views on Vision4Press platform.
Data correspond to usage on the plateform after 2015. The current usage metrics is available 48-96 hours after online publication and is updated daily on week days.
Initial download of the metrics may take a while.