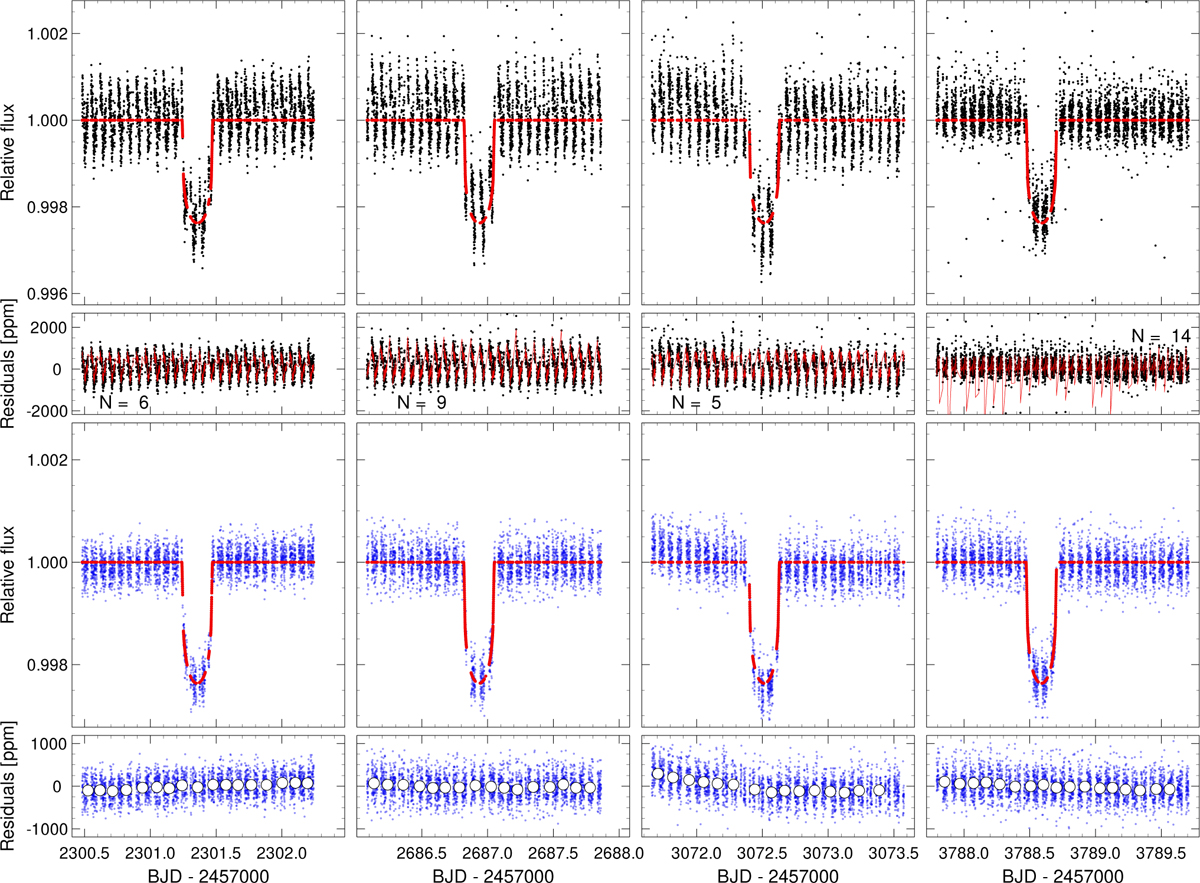
Fig. 2
Download original image
Demonstration of the fitting and detrending steps. The raw CHEOPS light curves of HD 95338b are shown in the top row, along with the initially fitted transit curves (step 1). The residuals of the initial transit fit, along with the best-fit systematics model is shown in the second row, with N number of harmonics of the roll angle included. The final transit fit (step 4) and its residuals (later used in the search for additional transits) are shown in the bottom two rows, where the full white circles represent 200-point bins (with an average uncertainty of ≈20 ppm in each bin).
Current usage metrics show cumulative count of Article Views (full-text article views including HTML views, PDF and ePub downloads, according to the available data) and Abstracts Views on Vision4Press platform.
Data correspond to usage on the plateform after 2015. The current usage metrics is available 48-96 hours after online publication and is updated daily on week days.
Initial download of the metrics may take a while.