Open Access
Fig. 3
Download original image
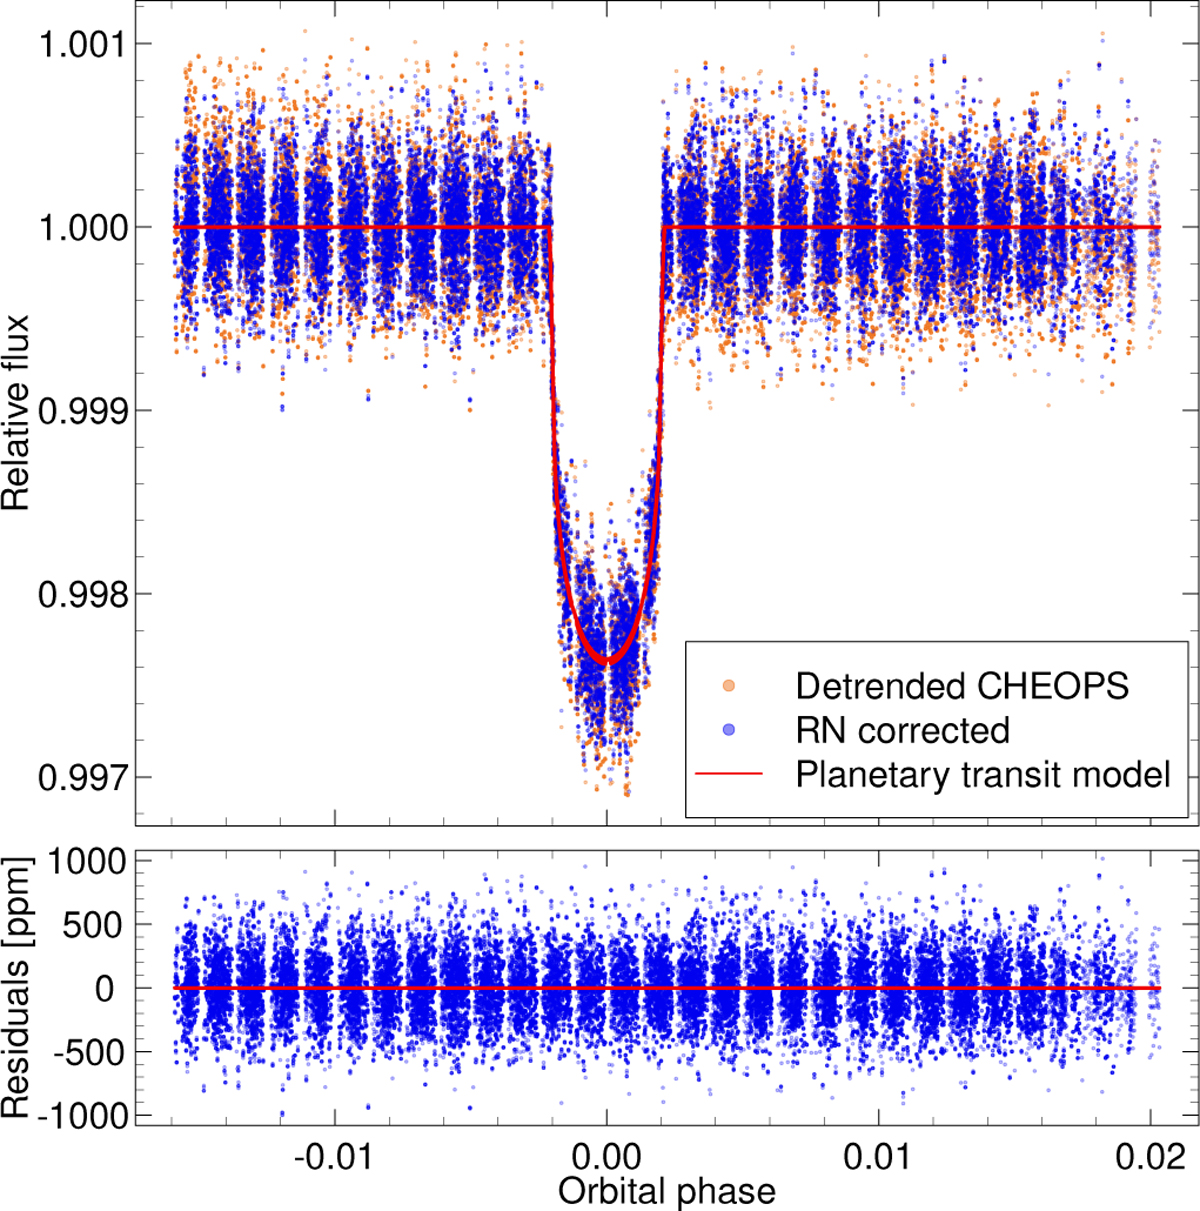
Phase-folded detrended CHEOPS light curve of HD 95338 (top panel, orange; same data as the third row of Fig. 2.) The rednoise-corrected light curve is shown with blue, while the best-fit transit light curves of HD 95338b is represented by the solid red curve.
Current usage metrics show cumulative count of Article Views (full-text article views including HTML views, PDF and ePub downloads, according to the available data) and Abstracts Views on Vision4Press platform.
Data correspond to usage on the plateform after 2015. The current usage metrics is available 48-96 hours after online publication and is updated daily on week days.
Initial download of the metrics may take a while.