Fig. 6
Download original image
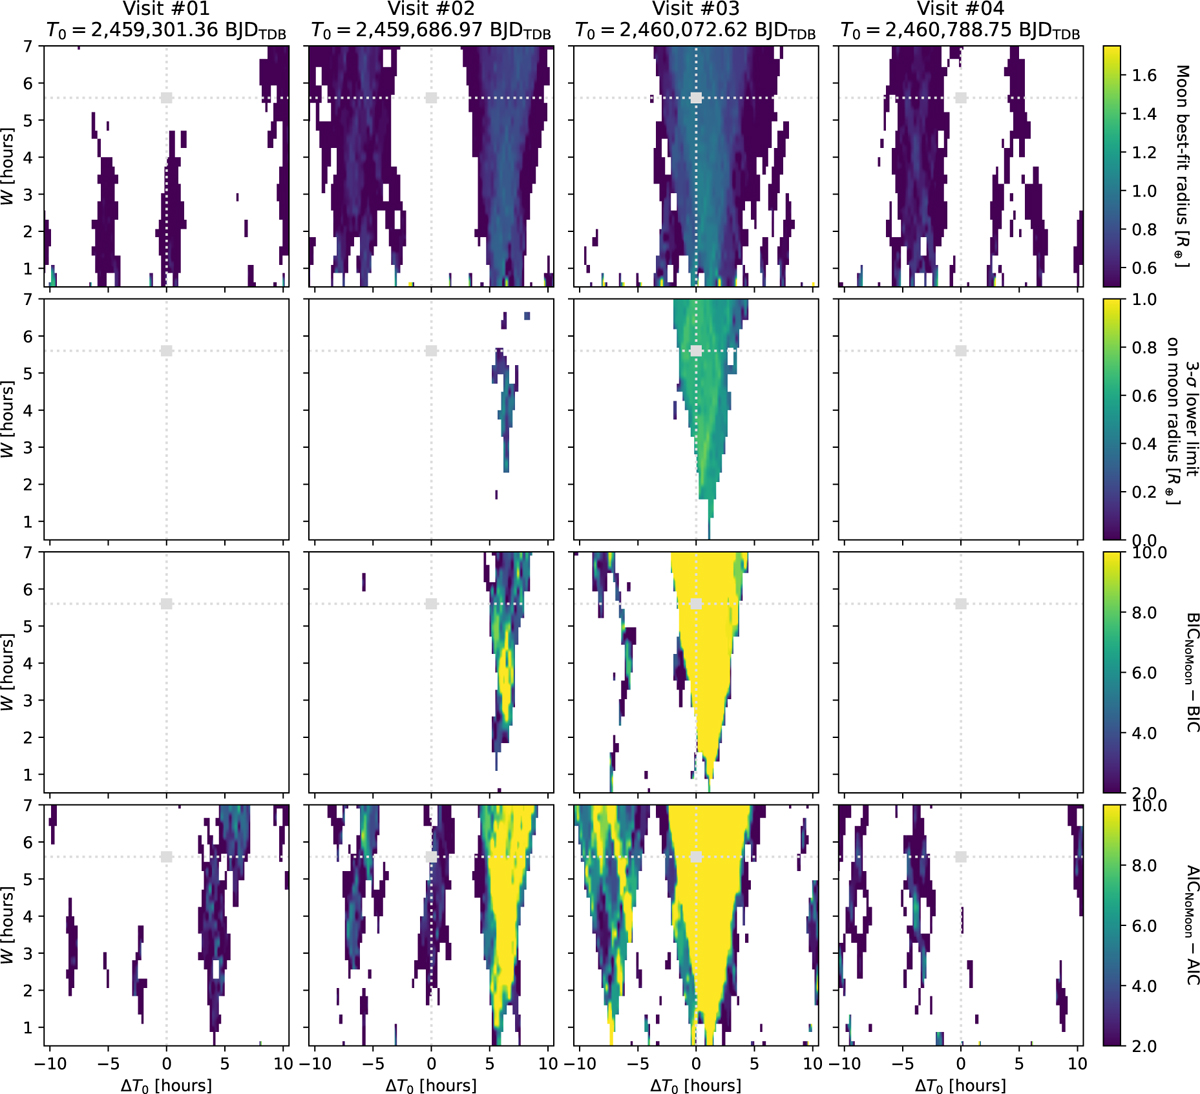
Sensitivity maps for the four CHEOPS visits of HD 95338. The first row represents the best-fit box depth (i.e. moon radius) in the ΔT0−W space. The 3σ lower limit of the moon radius is shown in the second row, while the third and fourth rows represent the ΔBIC and ΔAIC values between a solution with and without a moon. The empty (blank) areas are values that are below a threshold of 0 R⊕ for the moon radius (first 2 rows) and a threshold of 2 for the ΔBIC and ΔAIC (last 2 rows). The grey squares (and corresponding dotted lines) show the position of the transit of HD 95338b in this parameter space for each visit. An underlying linear trend is assumed for each of the four visits.
Current usage metrics show cumulative count of Article Views (full-text article views including HTML views, PDF and ePub downloads, according to the available data) and Abstracts Views on Vision4Press platform.
Data correspond to usage on the plateform after 2015. The current usage metrics is available 48-96 hours after online publication and is updated daily on week days.
Initial download of the metrics may take a while.