Open Access
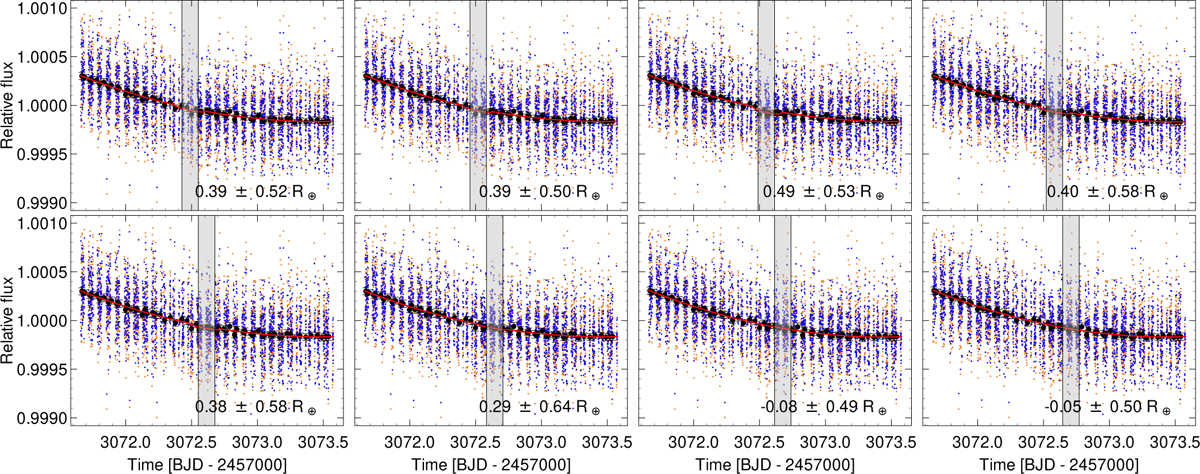
Fig. 7
Download original image
Results of the box-shifting method. The shaded gray areas represent the searchboxes within which the mid-time of the lunar transit is constrained. The best-fit moon radius and its 1σ uncertainty is shown on the bottom of each plot.
Current usage metrics show cumulative count of Article Views (full-text article views including HTML views, PDF and ePub downloads, according to the available data) and Abstracts Views on Vision4Press platform.
Data correspond to usage on the plateform after 2015. The current usage metrics is available 48-96 hours after online publication and is updated daily on week days.
Initial download of the metrics may take a while.