Fig. 4.
Download original image
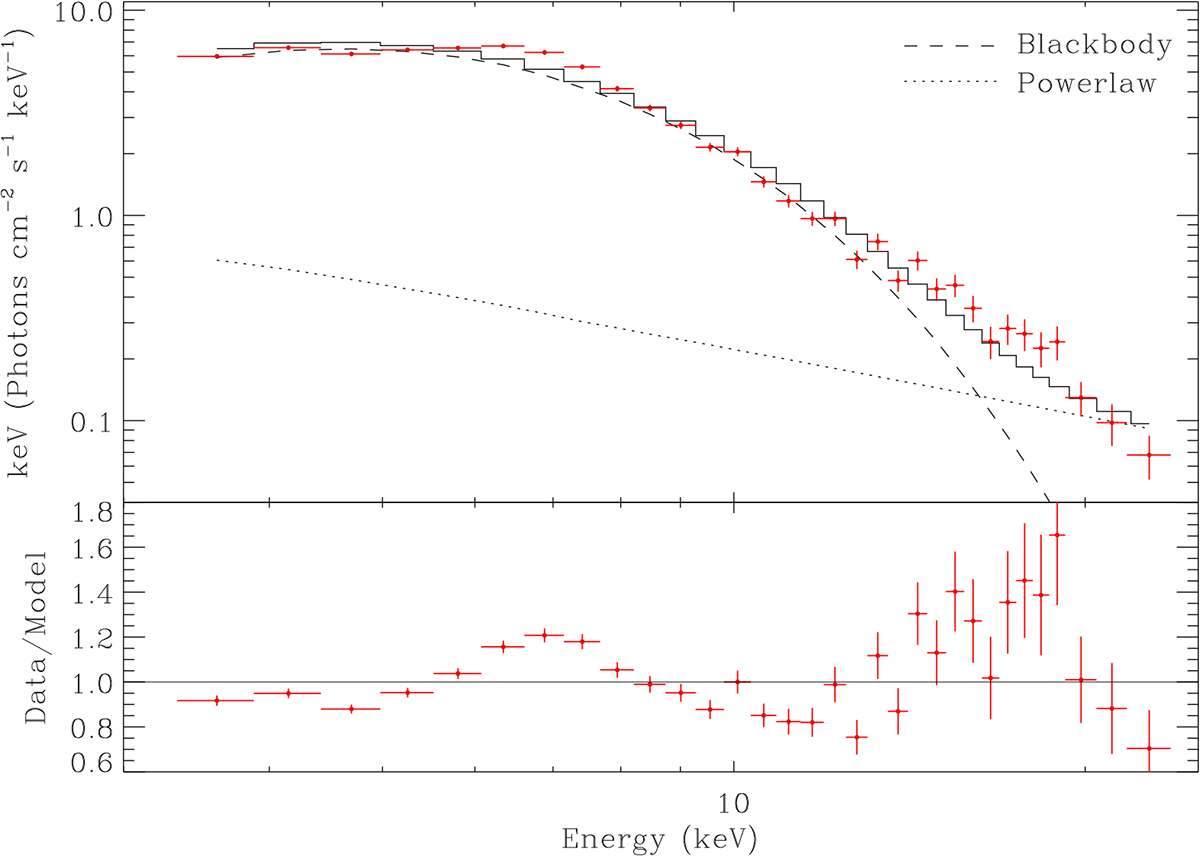
Spectral fitting for the thermonuclear X-ray burst observed from IGR J17591–2342 with AstroSat/LAXPC (see Section 4.2). The spectrum is for 8 − 10 s since the burst onset, and the XSPEC model is tbabs(bbodyrad+constant*powerlaw) with the powerlaw parameter values frozen to the pre-burst values (Section 3). Upper panel: Unfolded spectrum. Data with 1σ errors are shown in red. The total model (solid histogram), tbabs*bbodyrad component (dashed line), and tbabs*constant*powerlaw component (dotted line) are also shown. Lower panel: Data-to-model ratio with errors. This figure shows that this model is not adequate because there are two excesses in the ∼6 − 8 keV and ∼12 − 20 keV ranges.
Current usage metrics show cumulative count of Article Views (full-text article views including HTML views, PDF and ePub downloads, according to the available data) and Abstracts Views on Vision4Press platform.
Data correspond to usage on the plateform after 2015. The current usage metrics is available 48-96 hours after online publication and is updated daily on week days.
Initial download of the metrics may take a while.