Fig. 5.
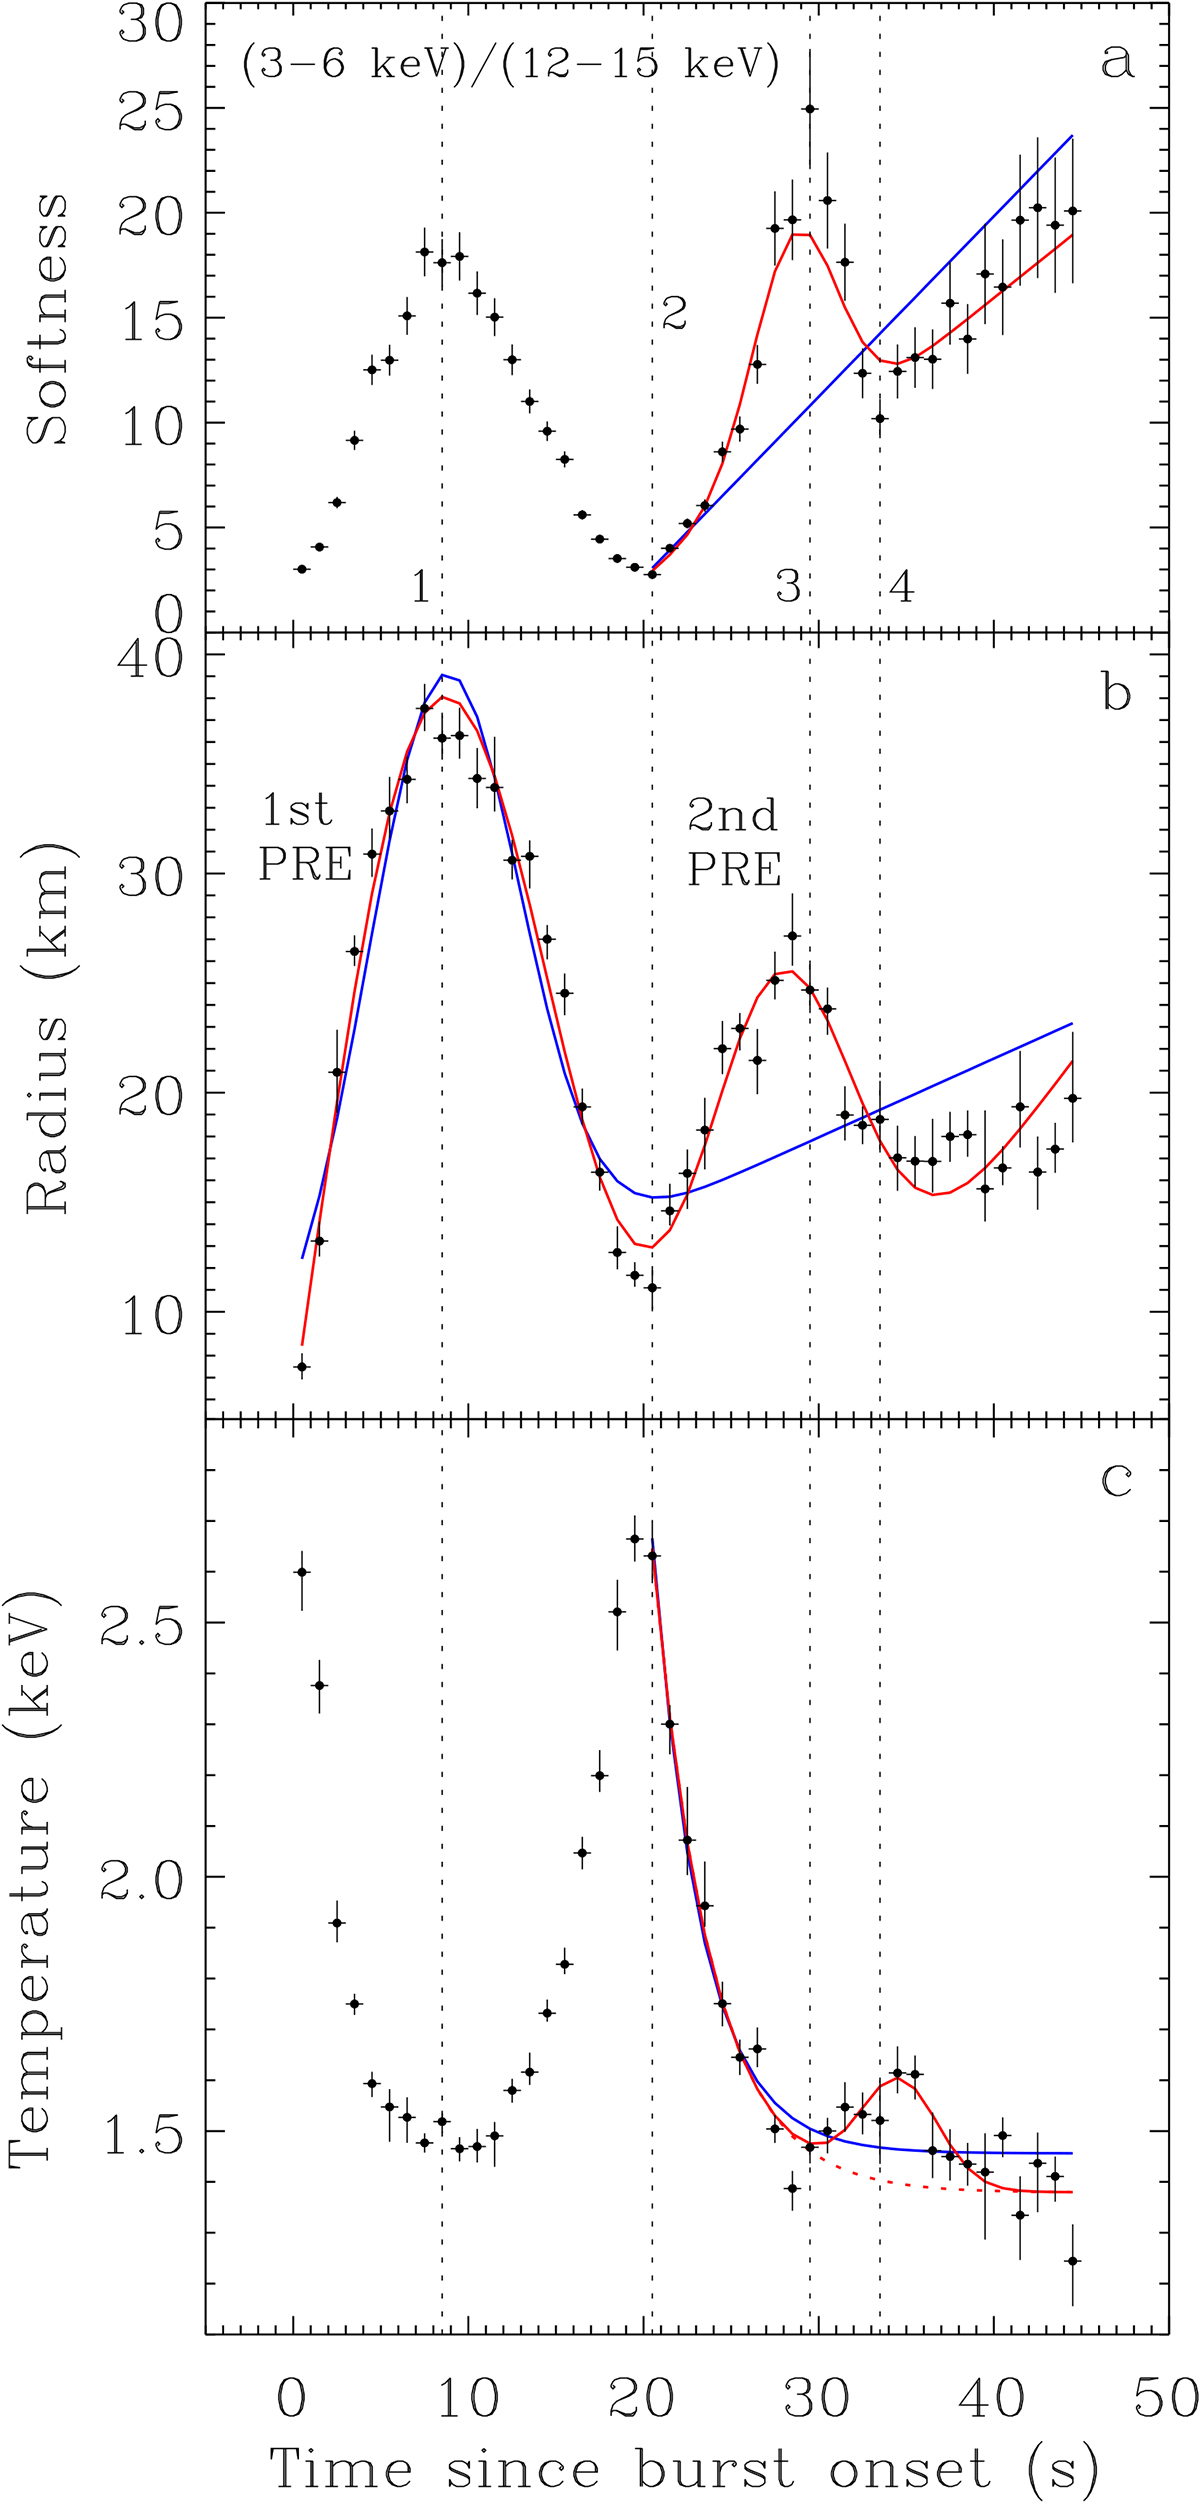
Download original image
Time-resolved (1 s bins) properties, with 1σ errors, of the thermonuclear X-ray burst observed from IGR J17591–2342 with AstroSat/LAXPC (see section 4.2.2). Parameter values of panels a, b, c are the same as panels c, d, e of Figure 2, respectively, and the vertical dotted lines mark the approximate maxima and minima of softness (panel a). The spectral parameter values of panels b and c were obtained by spectral fitting with the XSPEC model tbabs(bbodyrad+constant*powerlaw+gauss+gauss) and with powerlaw parameter values frozen to the pre-burst values (Section 3). In each panel, the blue best-fit model (solid line) does not include a Gaussian component for the hump, likely due to a second PRE, while the red best-fit model (solid line) includes such a component. An F-test between these two models shows the significance of the hump as likely being due to a second PRE (see Section 4.2.2). In panel c, the dotted red line is the solid red line minus its Gaussian component. Hence, a comparison between the solid and dotted red lines in panel c clearly shows the size of the blackbody temperature hump, which is likely due to a second PRE.
Current usage metrics show cumulative count of Article Views (full-text article views including HTML views, PDF and ePub downloads, according to the available data) and Abstracts Views on Vision4Press platform.
Data correspond to usage on the plateform after 2015. The current usage metrics is available 48-96 hours after online publication and is updated daily on week days.
Initial download of the metrics may take a while.