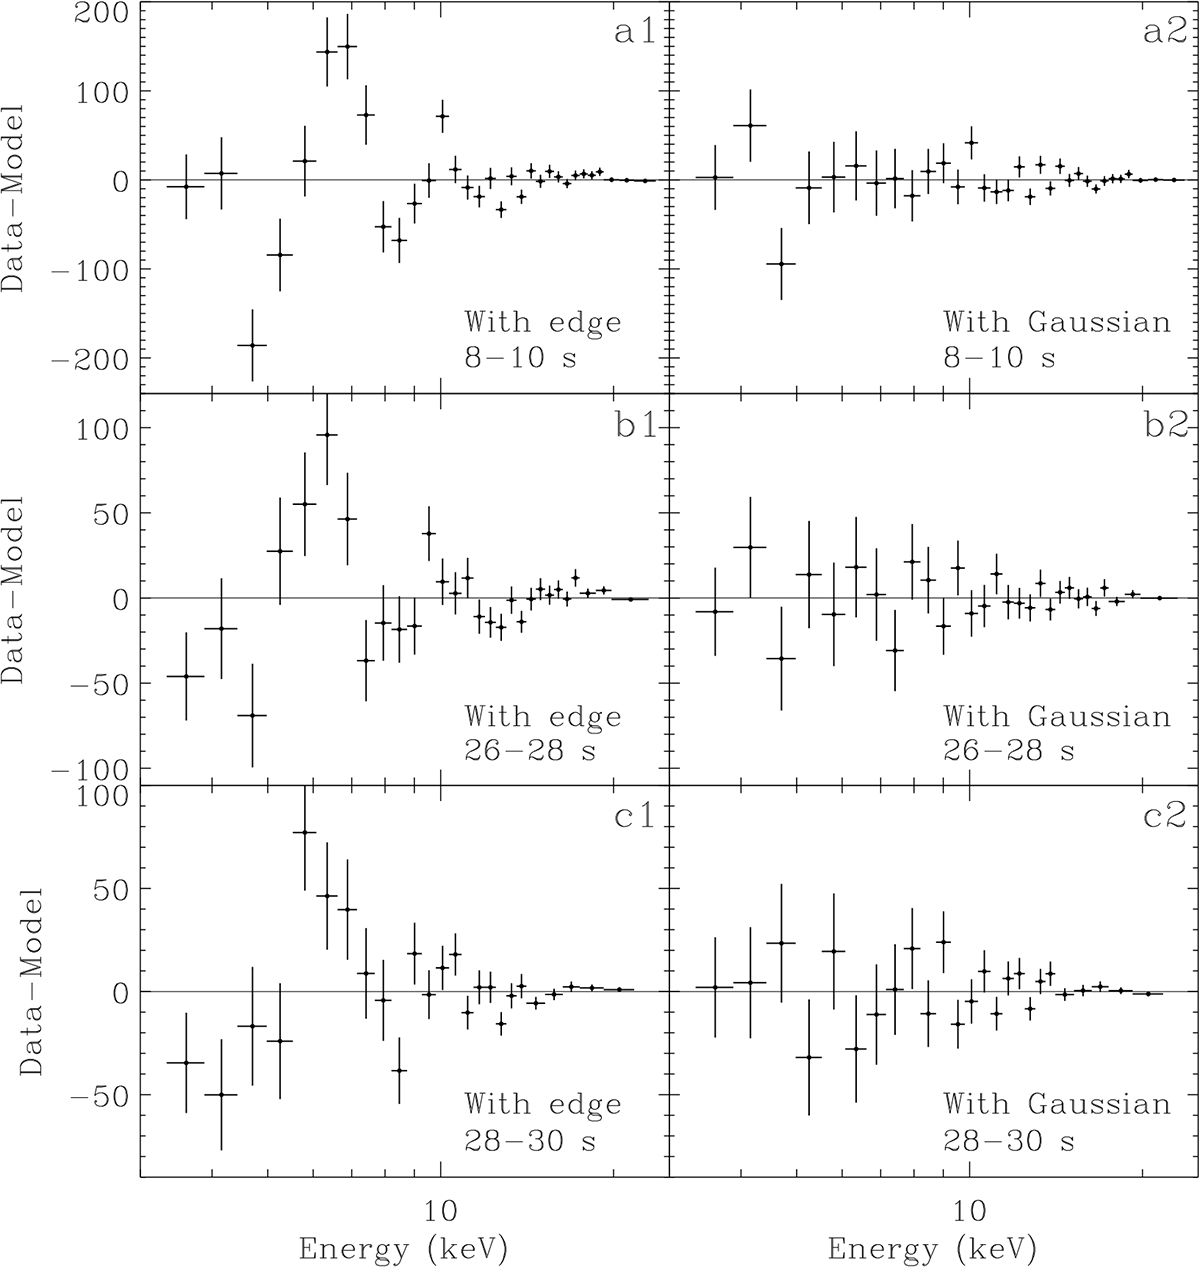
Fig. 8.
Download original image
Residuals (data−model) of fitting of the thermonuclear X-ray burst spectra (of 2 s time durations) observed from IGR J17591–2342 with AstroSat/LAXPC (see Section 4.3). Three spectra for 8 − 10 s (panels a1, a2), 26 − 28 s (panels b1, b2), and 28 − 30 s (panels c1, c2) since the burst onset are considered. These are times during the blackbody radius peaks. Left panels (a1, b1, c1) are for the XSPEC spectral model tbabs(edge*bbodyrad+constant*powerlaw), and right panels (a2, b2, c2) are for the model tbabs(bbodyrad+constant*powerlaw+gauss+gauss) (the second Gaussian in ∼12 − 20 keV is included if required). This figure shows that during the radius peaks, the model including Gaussian(s) fits the burst spectra better than the model including an edge does.
Current usage metrics show cumulative count of Article Views (full-text article views including HTML views, PDF and ePub downloads, according to the available data) and Abstracts Views on Vision4Press platform.
Data correspond to usage on the plateform after 2015. The current usage metrics is available 48-96 hours after online publication and is updated daily on week days.
Initial download of the metrics may take a while.