Fig. 14.
Download original image
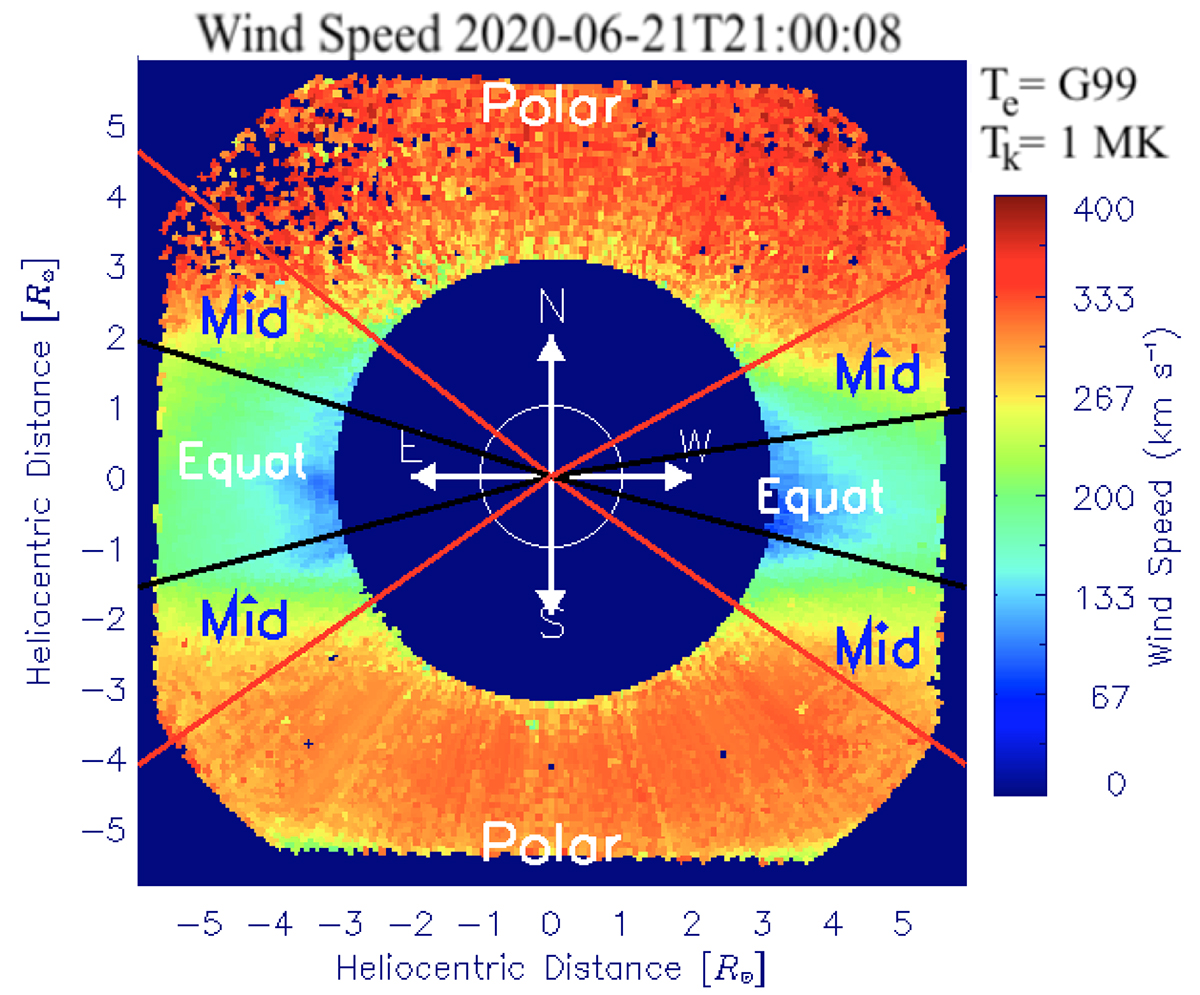
Solar wind speed map derived from Metis observations on June 21, 2020, with the coronal model assumptions of the Te radial profile from Gibson et al. (1999), Tk = 1.0 MK, Ki = 1, and AHe = 10%. The lines overlaid on the image identify the angular sectors we defined to study the radial speed trends for different coronal structures. The regions between the red lines are associated with polar coronal holes, and those between the black lines correspond to equatorial regions.
Current usage metrics show cumulative count of Article Views (full-text article views including HTML views, PDF and ePub downloads, according to the available data) and Abstracts Views on Vision4Press platform.
Data correspond to usage on the plateform after 2015. The current usage metrics is available 48-96 hours after online publication and is updated daily on week days.
Initial download of the metrics may take a while.