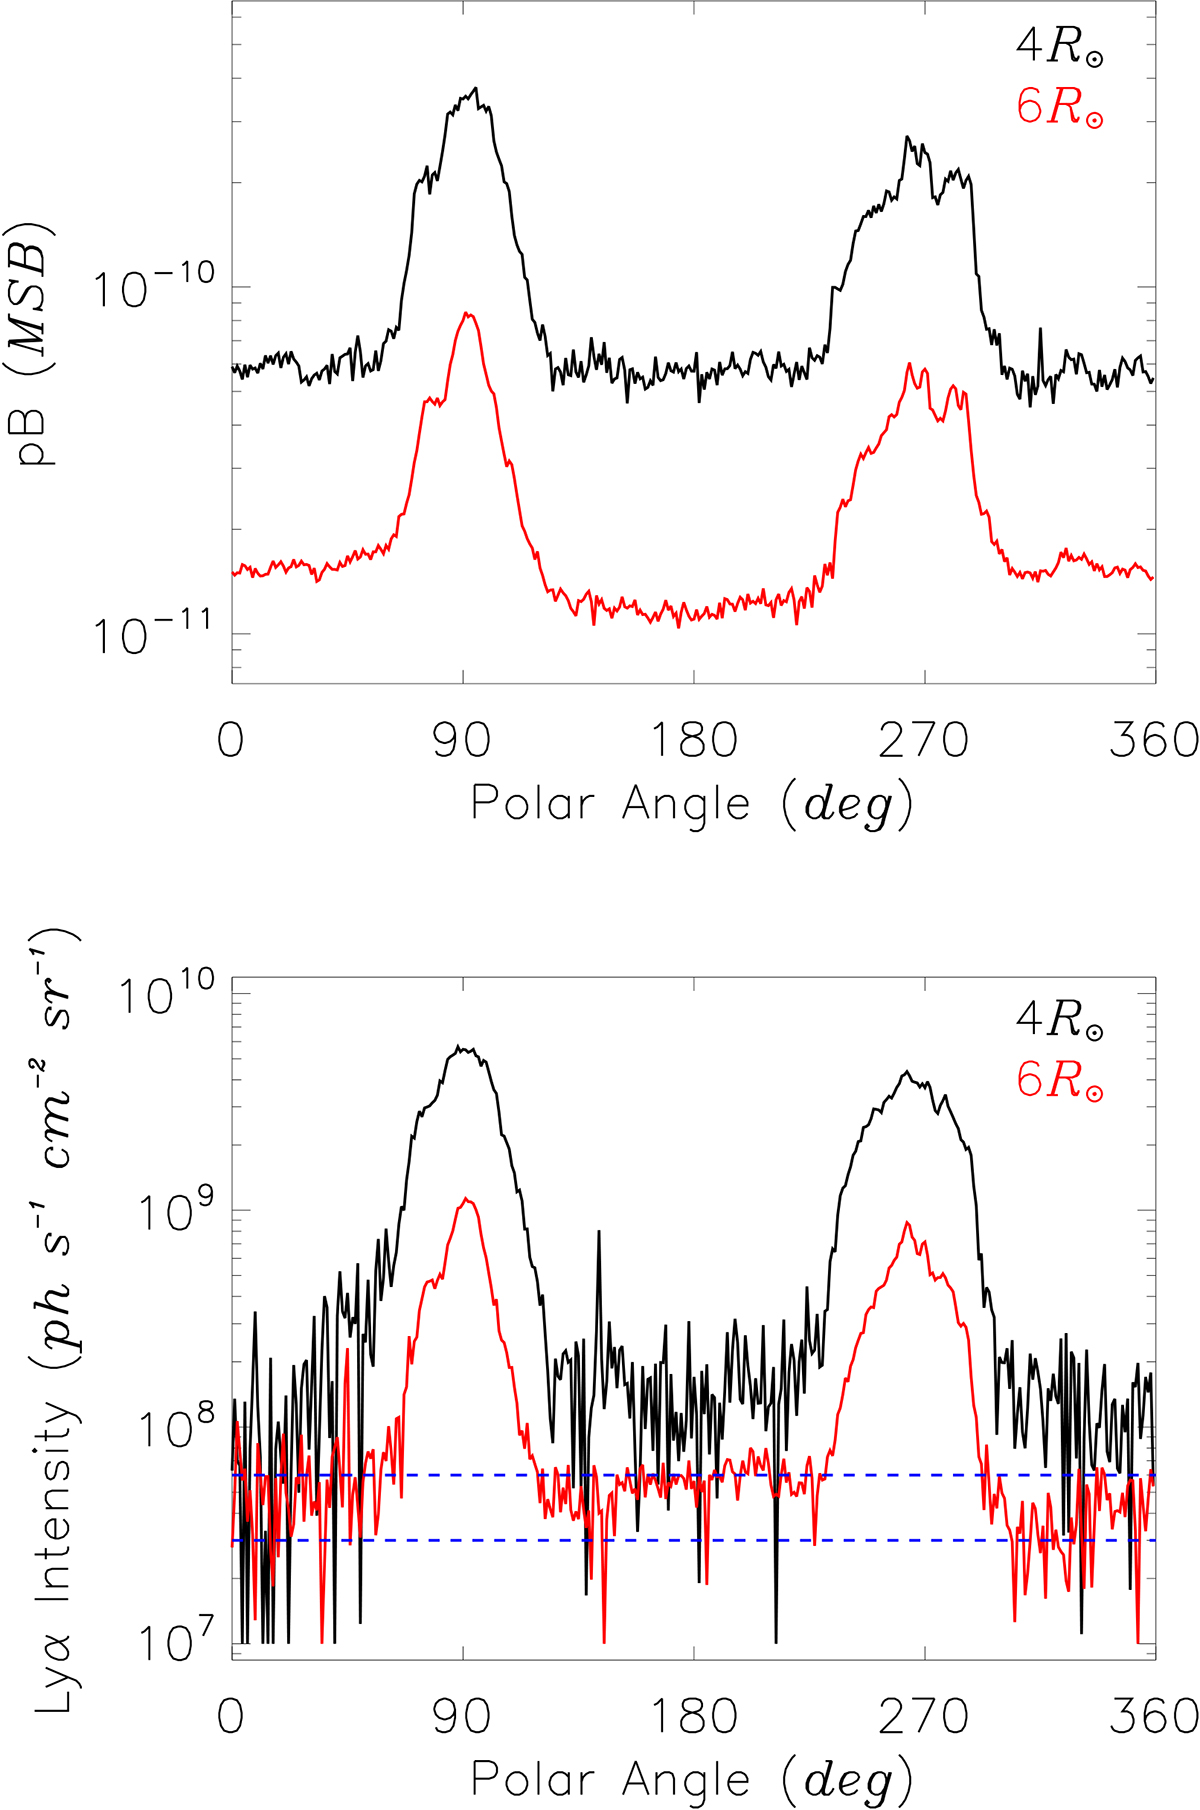
Fig. 4.
Download original image
Latitudinal distributions of the visible-light pB (top panel) and H I Lyα intensity (bottom panel) at 4.0 and 6.0 R⊙, derived from the maps shown in Fig. 3. The latitude is expressed in terms of the polar angle, measured counterclockwise from the north pole. In the bottom panel, the horizontal dashed blue lines mark the expected range of the H I Lyα interplanetary emission (3 − 6 × 10⁷ photons s−1 cm−2 sr−1; see, e.g., Kohl et al. 1997; Akinari 2007).
Current usage metrics show cumulative count of Article Views (full-text article views including HTML views, PDF and ePub downloads, according to the available data) and Abstracts Views on Vision4Press platform.
Data correspond to usage on the plateform after 2015. The current usage metrics is available 48-96 hours after online publication and is updated daily on week days.
Initial download of the metrics may take a while.