Fig. 7.
Download original image
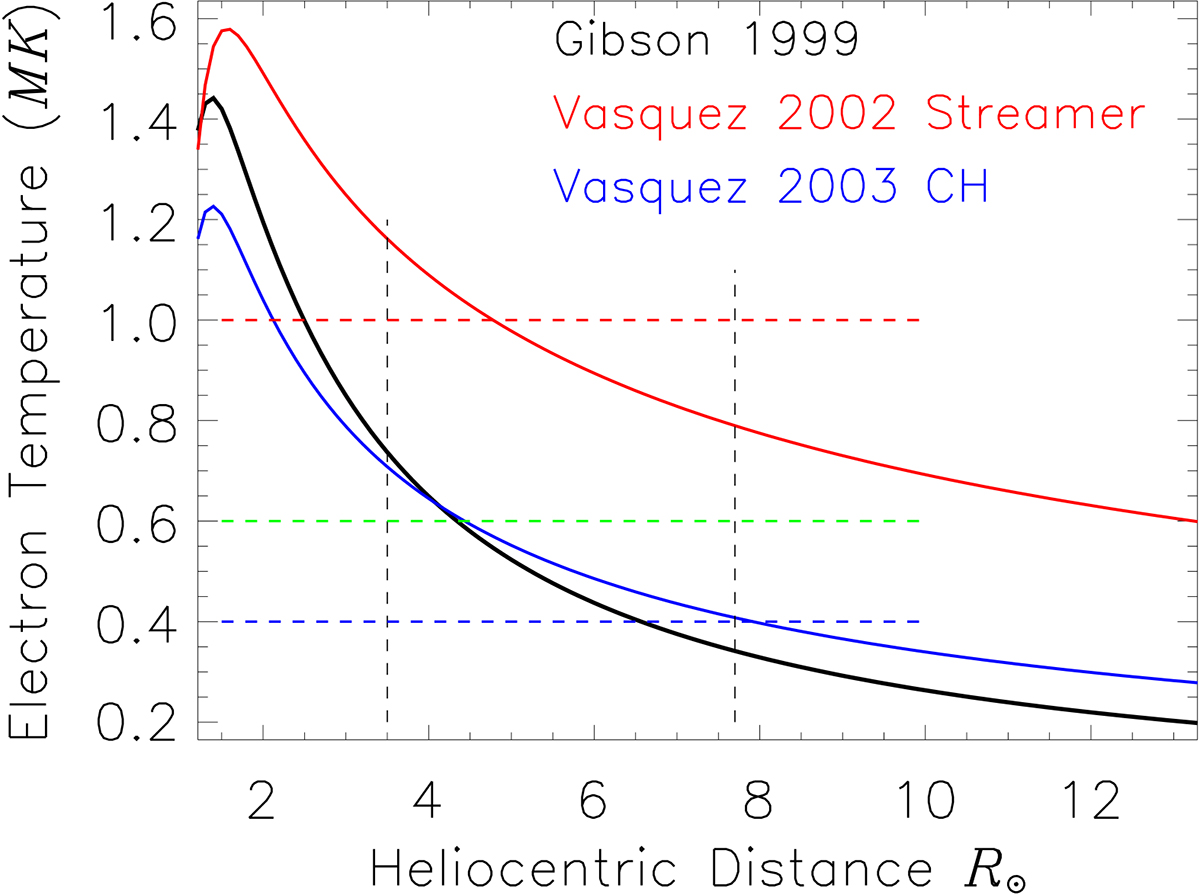
Electron temperature radial profile from Gibson et al. (1999) (black), Vásquez et al. (2003), coronal hole (blue), and streamer (red). The vertical dashed lines show the range of the field of view observed by Metis on January 14, 2021, and the horizontal dashed lines represents the different constant values: 0.4 (blue), 0.6 (green), and 1.0 (red) MK) assumed to compute the wind speed presented in Fig. 10.
Current usage metrics show cumulative count of Article Views (full-text article views including HTML views, PDF and ePub downloads, according to the available data) and Abstracts Views on Vision4Press platform.
Data correspond to usage on the plateform after 2015. The current usage metrics is available 48-96 hours after online publication and is updated daily on week days.
Initial download of the metrics may take a while.