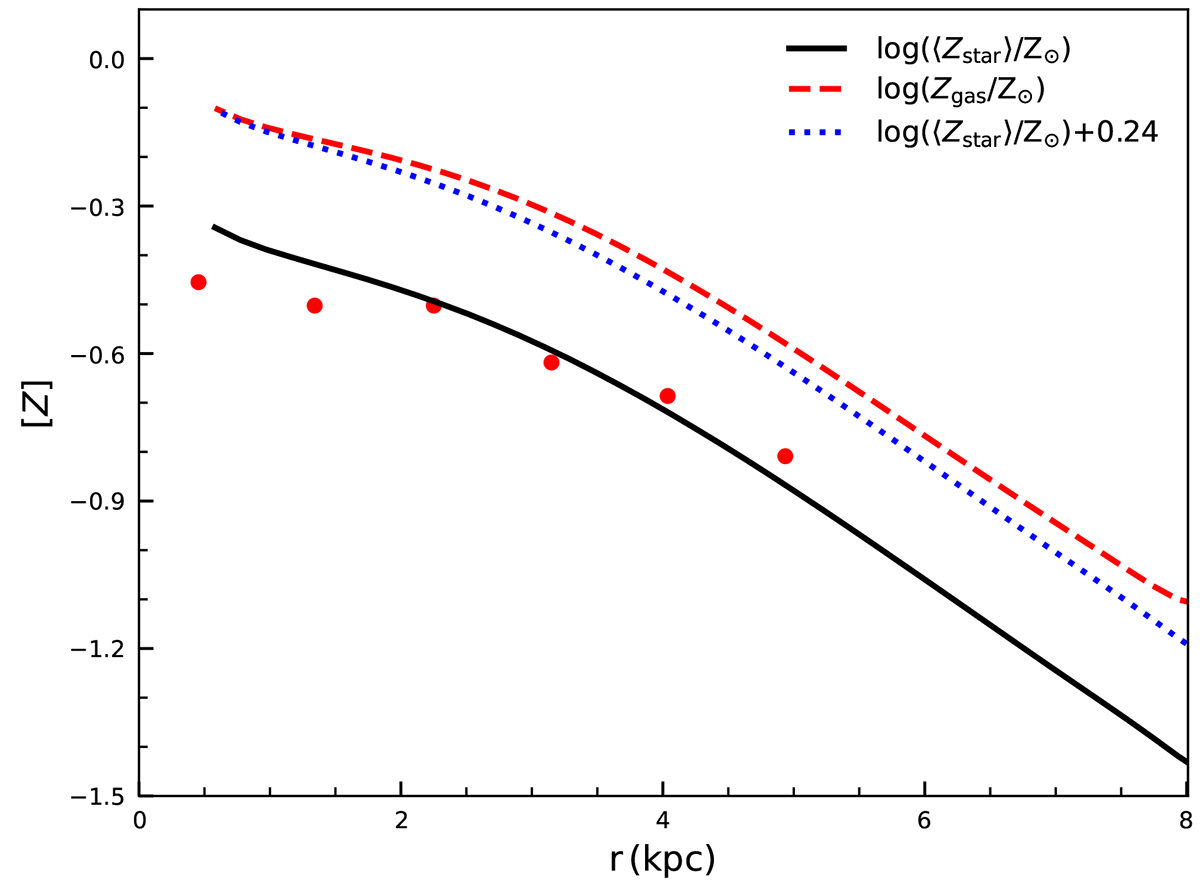
Fig. 4.
Download original image
Radial distribution of the mean metallicity of the entire stellar population. Observations obtained from the photometric analysis of colour-maginitude diagrams (CMD, Gogarten et al. 2010) are shown as red circles and the Model B prediction is displayed as the black solid line. The Model B predicted metallicity of the ISM and the very young stars is additionally shown as the red dashed curve. For comparison purposes, the blue dotted curve represents the black curve shifted by +0.24 dex.
Current usage metrics show cumulative count of Article Views (full-text article views including HTML views, PDF and ePub downloads, according to the available data) and Abstracts Views on Vision4Press platform.
Data correspond to usage on the plateform after 2015. The current usage metrics is available 48-96 hours after online publication and is updated daily on week days.
Initial download of the metrics may take a while.