Fig. 6.
Download original image
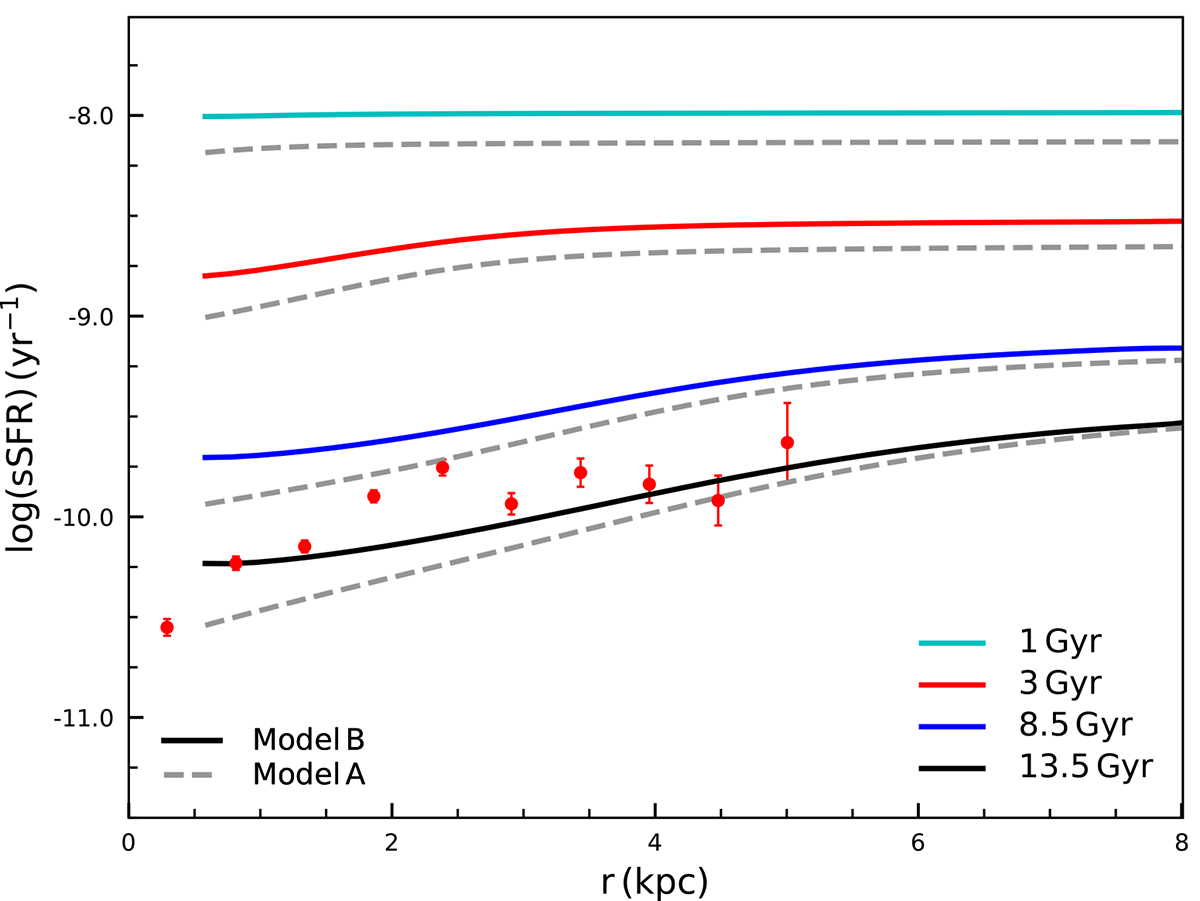
Cosmic time evolution of sSFR radial profiles. The solid lines in different colours represent Model B at 1 Gyr (cyan), 3 Gyr (red), 8.5 Gyr (blue), and 13.5 Gyr (present-day, black). The corresponding results by Model A are shown as grey dashed lines. The red filled circles are the observed data, the same as those in the top right panel of Fig. 2.
Current usage metrics show cumulative count of Article Views (full-text article views including HTML views, PDF and ePub downloads, according to the available data) and Abstracts Views on Vision4Press platform.
Data correspond to usage on the plateform after 2015. The current usage metrics is available 48-96 hours after online publication and is updated daily on week days.
Initial download of the metrics may take a while.