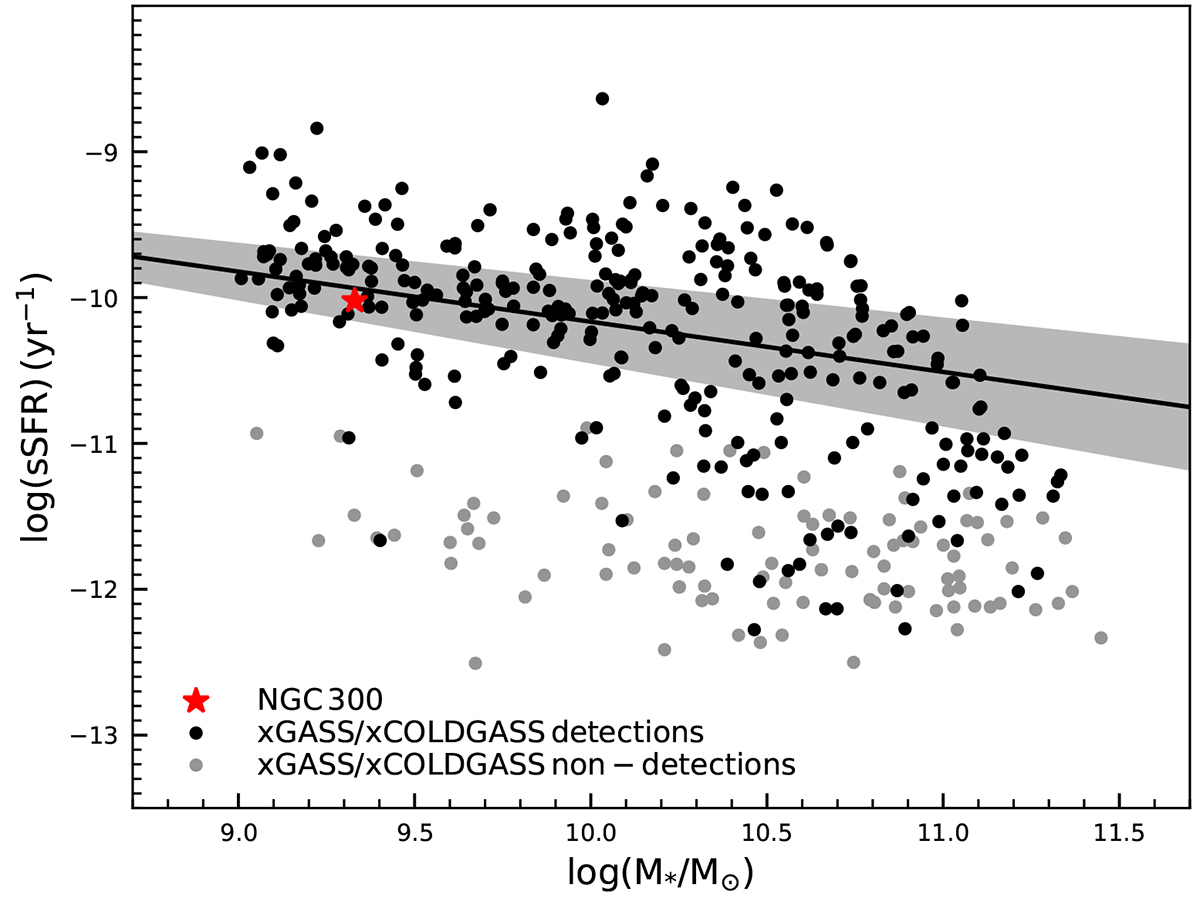
Fig. 7.
Download original image
Specific SFR as a function of stellar mass, for the Model B predicted sSFR for NGC 300 (red solid star) and for the observed sSFR of xGASS and xCOLDGASS (Saintonge et al. 2017; Catinella et al. 2018). The solid line refers to the star-forming galaxy main sequence, and the grey shaded region represents the 1σ deviation (Eq. (2) in Catinella et al. 2018). Black filled circles refer to the observed SFR in nearby galaxies from xGASS and xCOLDGASS detections, while the grey filled circles denote non-detections in both xGASS and xCOLDGASS.
Current usage metrics show cumulative count of Article Views (full-text article views including HTML views, PDF and ePub downloads, according to the available data) and Abstracts Views on Vision4Press platform.
Data correspond to usage on the plateform after 2015. The current usage metrics is available 48-96 hours after online publication and is updated daily on week days.
Initial download of the metrics may take a while.