Fig. 3
Download original image
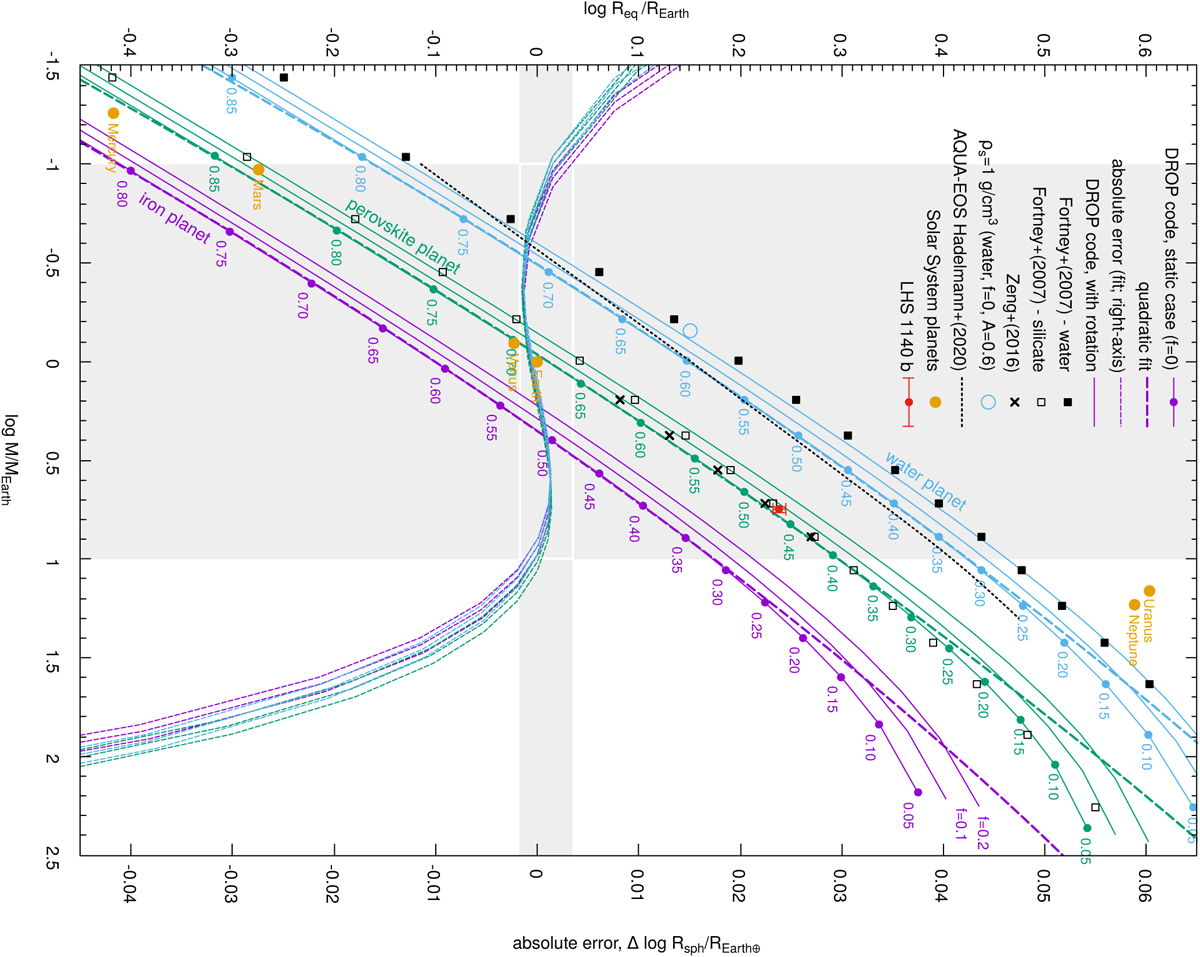
Mass–radius relationships (left axis) computed with the DROP code in the single layer case, for iron (purple), perovskite (green), and water (cyan), and for three flattening parameters, f ∈> {0,0.1,0.2}. Values of the input parameter A are indicated along the curves for f = 0, as described in Eq. (8). The domain where the fits are performed is indicated (grey-shaded zone) as well as the absolute error (right axis). The result obtained with ρs = 1 g/cm3, f = 0 and A = 0.6 for water in Eq. (4) is shown for comparison (cyan open circle). Also plotted are the empirical relationship valid in the range 1-8 M⊕ and built from the Earth’s model by Zeng et al. (2016) (black crosses), the data from Table B.1 of Haldemann et al. (2020) obtained from the AQUA-EoS for water assuming a 300 K surface temperature (thin, dotted lines) and the results by Fortney et al. (2007) for pure-water and pure-silicate planets (open and filled squares), all obtained in the static case. See Sect. 6 for a discussion about LHS 1140 b (red dot).
Current usage metrics show cumulative count of Article Views (full-text article views including HTML views, PDF and ePub downloads, according to the available data) and Abstracts Views on Vision4Press platform.
Data correspond to usage on the plateform after 2015. The current usage metrics is available 48-96 hours after online publication and is updated daily on week days.
Initial download of the metrics may take a while.