Open Access
Fig. 1.
Download original image
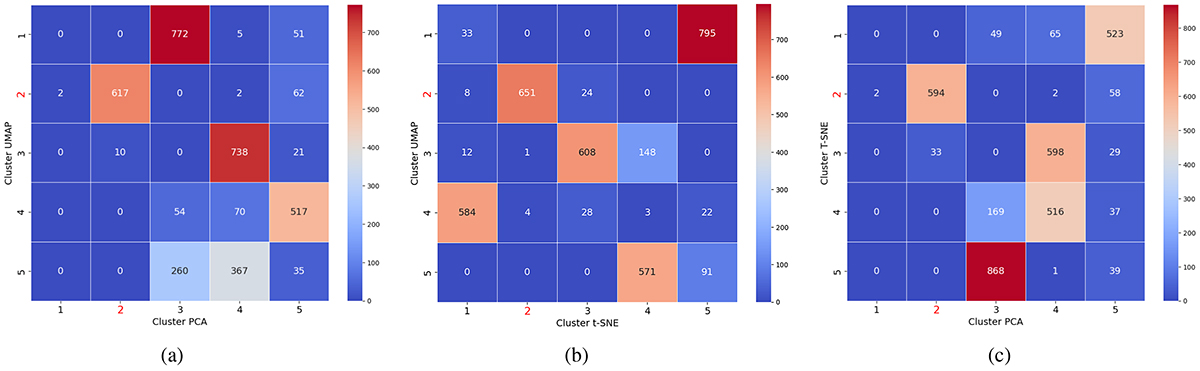
Cluster overlap across the three dimensionality reduction techniques. The label of the clusters of interest are highlighted in red. (a) Cluster overlap between PCA and UMAP. (b) Cluster overlap between UMAP and t-SNE. (c) Cluster overlap between PCA and t-SNE.
Current usage metrics show cumulative count of Article Views (full-text article views including HTML views, PDF and ePub downloads, according to the available data) and Abstracts Views on Vision4Press platform.
Data correspond to usage on the plateform after 2015. The current usage metrics is available 48-96 hours after online publication and is updated daily on week days.
Initial download of the metrics may take a while.