Fig. 1.
Download original image
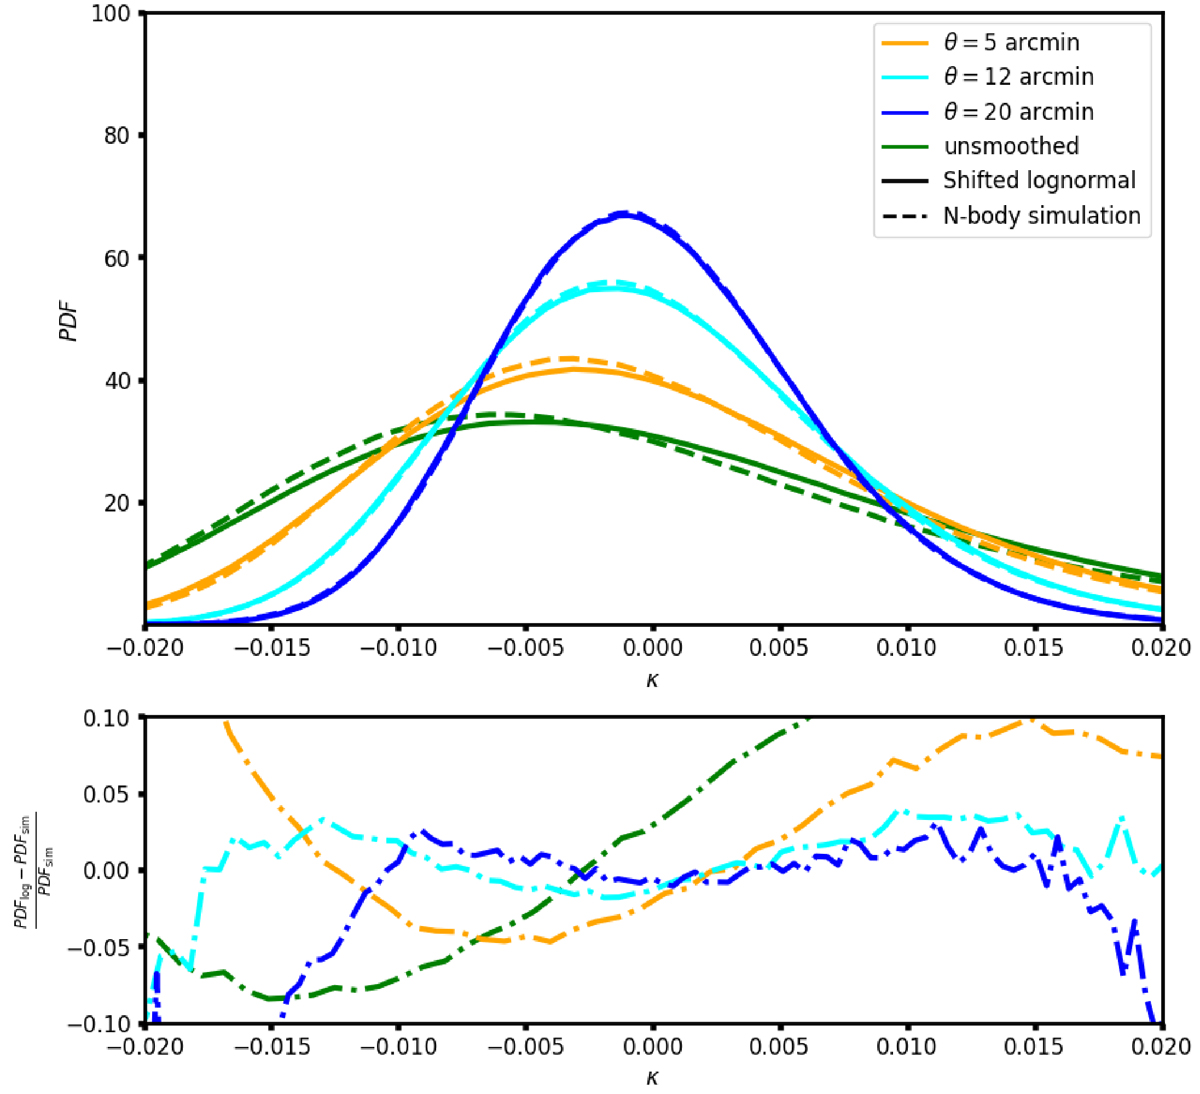
Comparison of the one-point PDF from N-body simulations and from maps generated by shifted log-normal modelling. Top panel: Distributions of the shifted log-normally generated maps (solid lines) and N-body simulations (dashed lines) for the unsmoothed case (in green) and at a smoothing angle of θ = 5 arcmin, θ = 12 arcmin, and at θ = 20 arcmin, as labelled. Bottom panel: Relative residuals of the log-normal PDF with respect to the N-body simulation.
Current usage metrics show cumulative count of Article Views (full-text article views including HTML views, PDF and ePub downloads, according to the available data) and Abstracts Views on Vision4Press platform.
Data correspond to usage on the plateform after 2015. The current usage metrics is available 48-96 hours after online publication and is updated daily on week days.
Initial download of the metrics may take a while.