Open Access
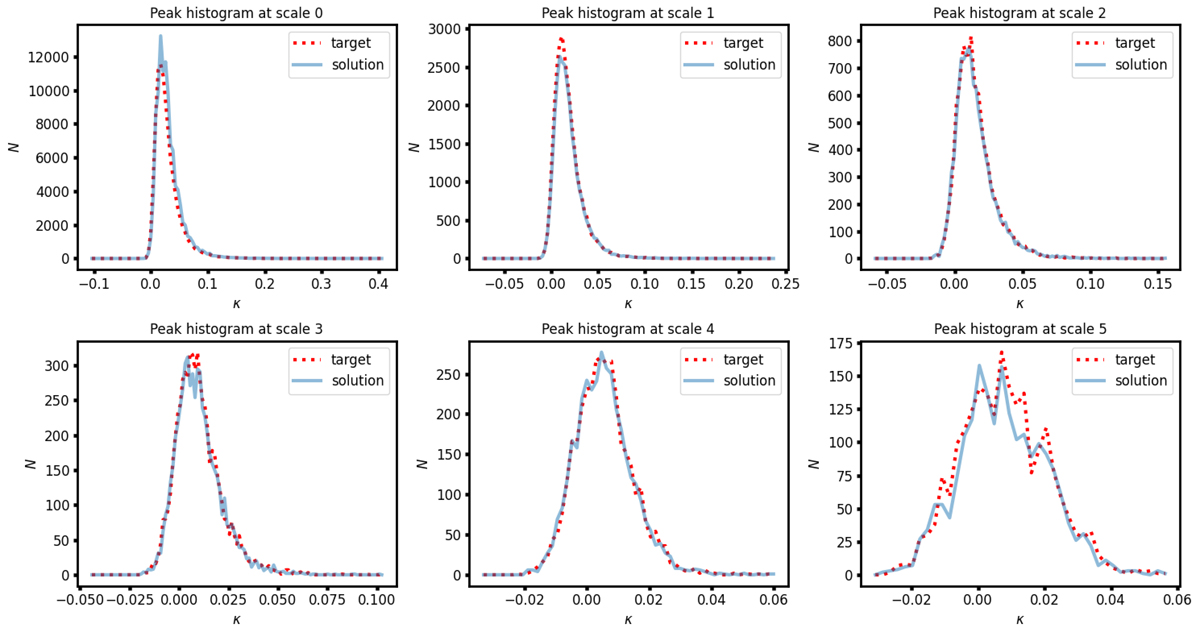
Fig. B.2.
Download original image
Peak count distribution at different wavelet scales as labelled for the target (dotted red line) and emulated maps (blue solid line). Emulated maps reproduce the peak counts of the target with high fidelity at small to intermediate scales.
Current usage metrics show cumulative count of Article Views (full-text article views including HTML views, PDF and ePub downloads, according to the available data) and Abstracts Views on Vision4Press platform.
Data correspond to usage on the plateform after 2015. The current usage metrics is available 48-96 hours after online publication and is updated daily on week days.
Initial download of the metrics may take a while.