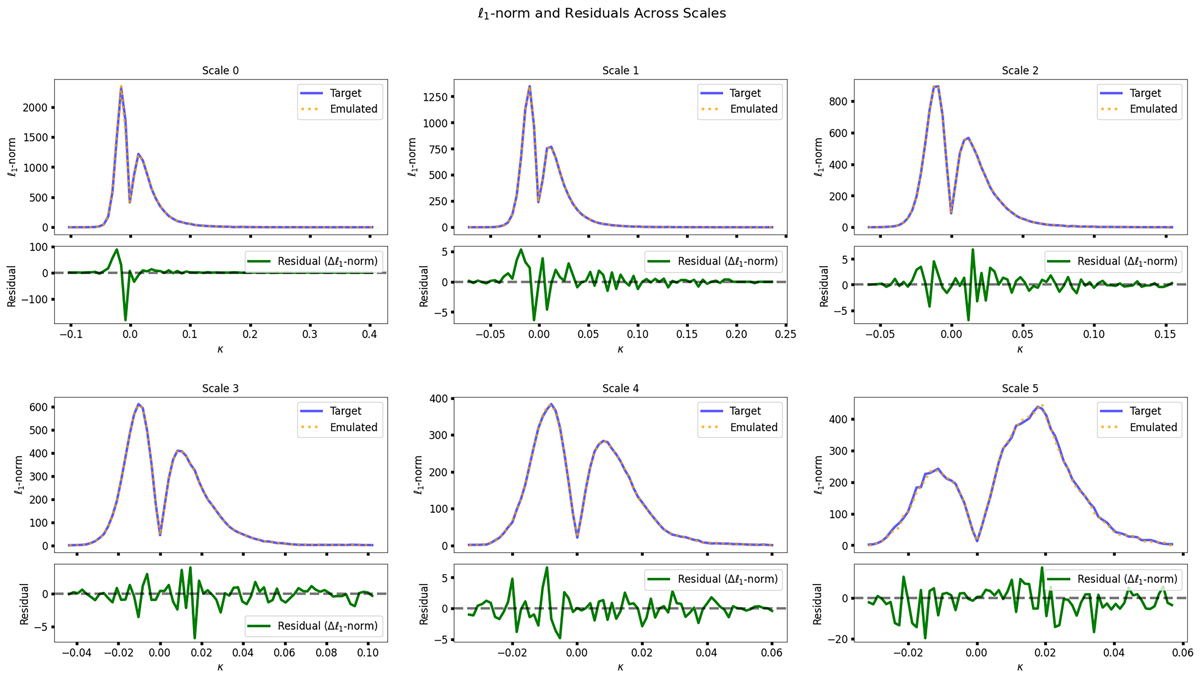
Fig. 5.
Download original image
Wavelet ℓ1-norm at each scale and its residual between the decomposed target image (solid blue line) and the emulated image (dashed orange line) across different scales. The residuals, which are obtained as the difference between the target and the emulated wavelet ℓ1-norms, are also presented (dashed green line), reflecting the accuracy of the emulation process in reproducing the target distributions.
Current usage metrics show cumulative count of Article Views (full-text article views including HTML views, PDF and ePub downloads, according to the available data) and Abstracts Views on Vision4Press platform.
Data correspond to usage on the plateform after 2015. The current usage metrics is available 48-96 hours after online publication and is updated daily on week days.
Initial download of the metrics may take a while.