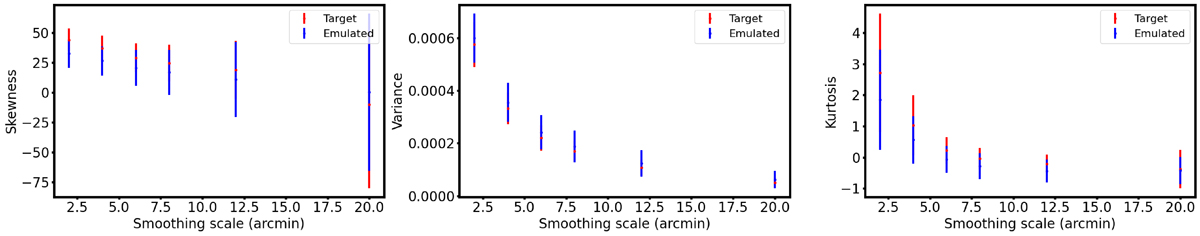
Fig. 7.
Download original image
Variance and skewness for the target image (in red) and the emulated image (in blue) obtained using a tophat scaling function to derive the wavelet. The emulated image was created by an algorithm that matched the wavelet ℓ1-norm of the target image from the SLICS simulation. Benchmarking was conducted by smoothing both images with different radii via a tophat filter, partitioning them into patches, and calculating skewness, variance, kurtosis, and their associated error bars by taking the standard deviation of the values obtained from four different patches of the maps. The x-axis represents the smoothing scale in arcminutes.
Current usage metrics show cumulative count of Article Views (full-text article views including HTML views, PDF and ePub downloads, according to the available data) and Abstracts Views on Vision4Press platform.
Data correspond to usage on the plateform after 2015. The current usage metrics is available 48-96 hours after online publication and is updated daily on week days.
Initial download of the metrics may take a while.