Open Access
Fig. 8.
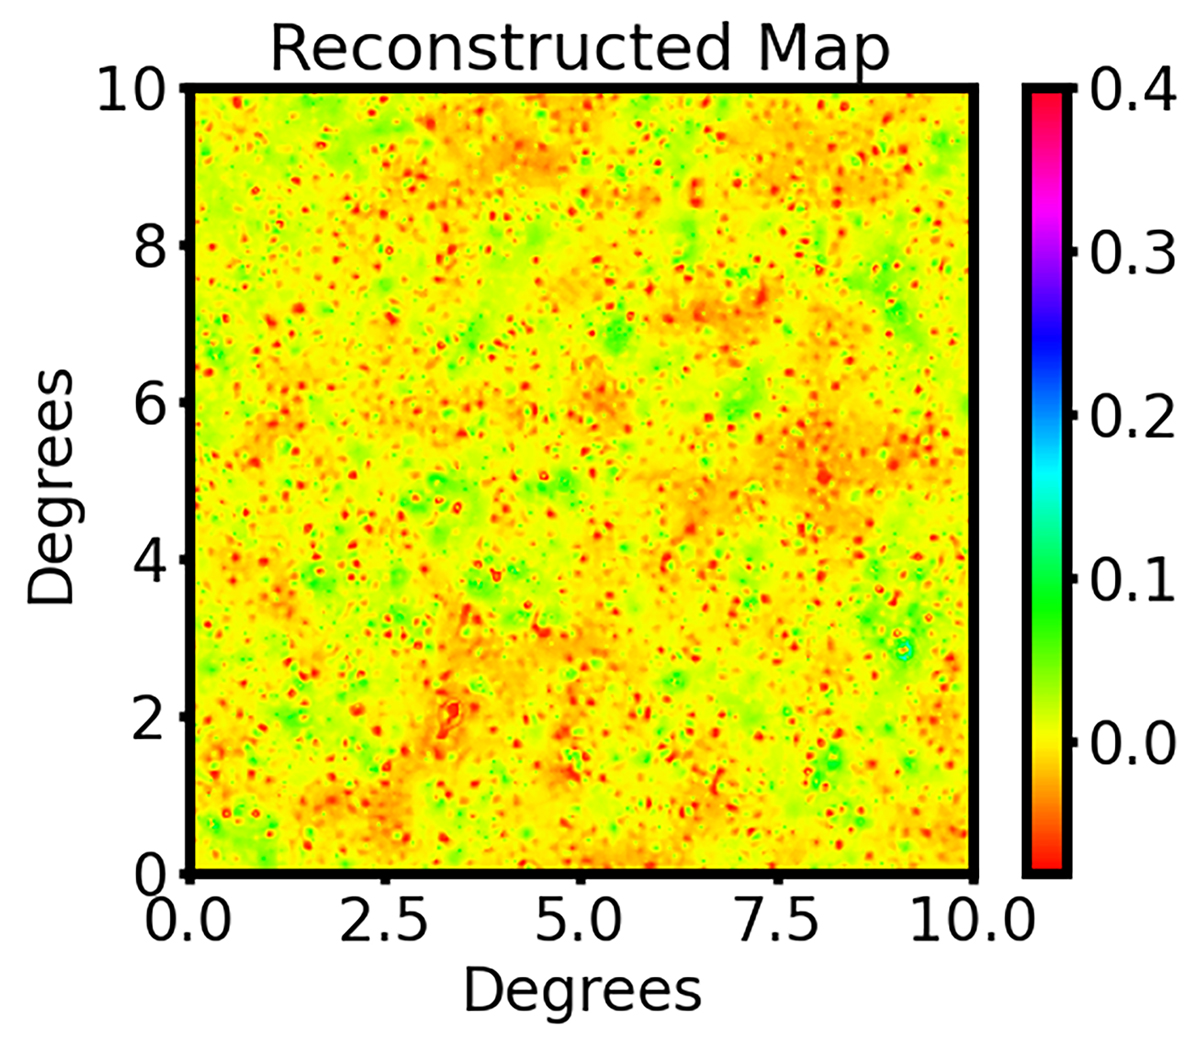
Download original image
Emulated convergence map produced by our pipeline with a pixel size of 2 arcmin, generated by applying constraints on the first three scales for which the theory-based wavelet ℓ1-norm is obtained. The x- and y-axes represent the map range in degrees, and the pixel values are indicated by the colour bar.
Current usage metrics show cumulative count of Article Views (full-text article views including HTML views, PDF and ePub downloads, according to the available data) and Abstracts Views on Vision4Press platform.
Data correspond to usage on the plateform after 2015. The current usage metrics is available 48-96 hours after online publication and is updated daily on week days.
Initial download of the metrics may take a while.