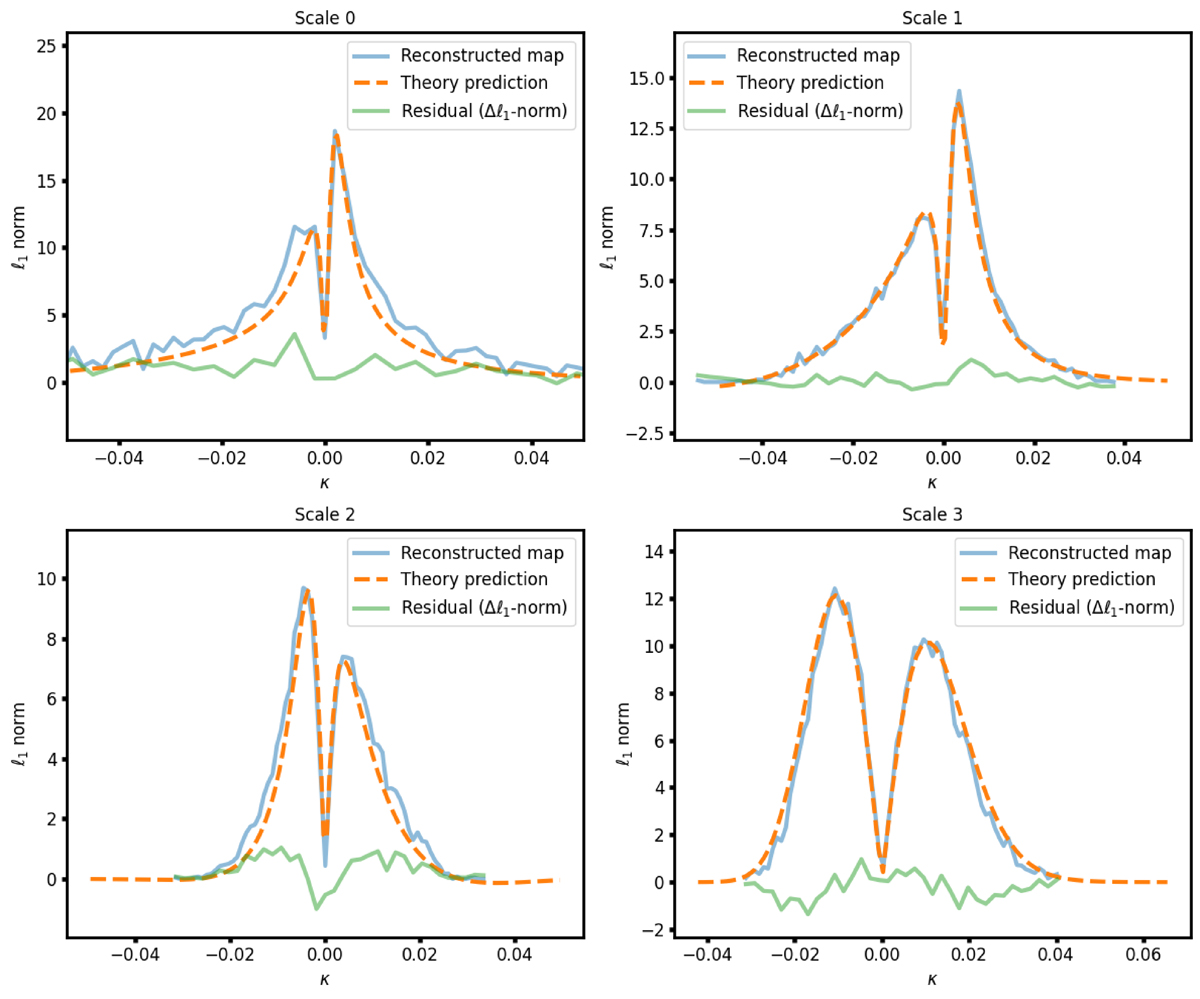
Fig. 9.
Download original image
Comparison of the wavelet ℓ1-norm of the generated map (solid blue line) with the theoretical predictions (dashed orange line) across different scales ranging from 2 to 8 arcmin, shown from the top left to the bottom right panel. The final panel represents the coarse scale at 8 arcmin. The residuals (solid green line) between the target and emulated wavelet ℓ1-norms are also shown, indicating the accuracy of the emulation process in reproducing the expected distributions.
Current usage metrics show cumulative count of Article Views (full-text article views including HTML views, PDF and ePub downloads, according to the available data) and Abstracts Views on Vision4Press platform.
Data correspond to usage on the plateform after 2015. The current usage metrics is available 48-96 hours after online publication and is updated daily on week days.
Initial download of the metrics may take a while.