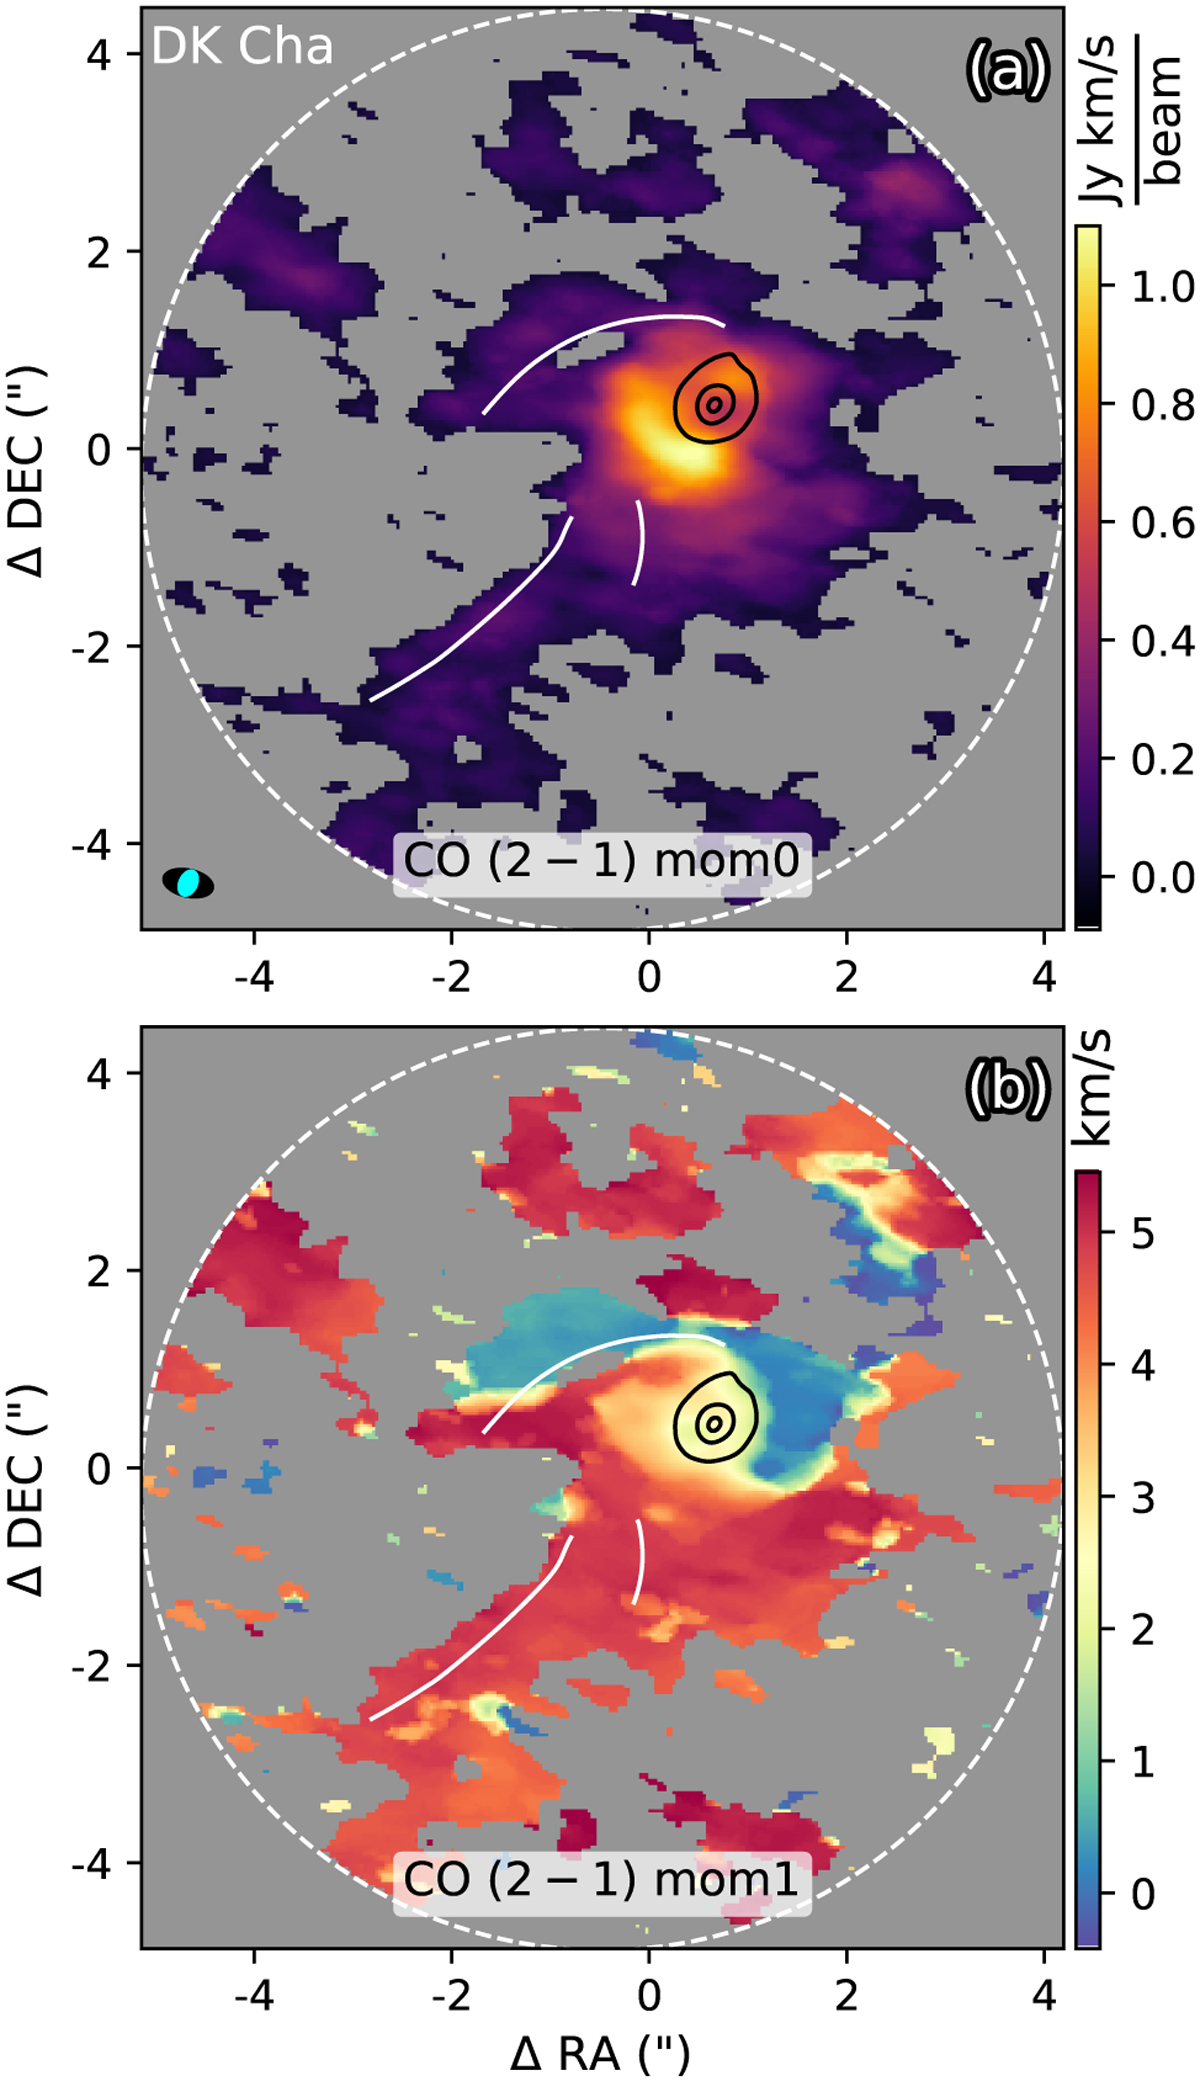
Fig. 11
Download original image
Moment maps of CO (2-1) for DK Cha. Only data within the velocity interval of 0–5 km s–1 were utilized to calculate the moment maps (Sect. 3.2.1). Velocity channels with intensities exceeding 3σ are included in the moment map calculation. In each panel, data outside the dashed white circle have been masked out. White curves represent the streamers identified from the SO emission (Fig. 8). The black contours denote the ALMA continuum, as shown in panel a of Fig. 8. The two ALMA observations were conducted in 2015 and 2023, respectively (Sect. 2). Position shifts due to proper motion and/or possible phase calibration uncertainties have been corrected by cross-matching their continuum peaks, determined via 2D Gaussian fitting. In panel a, the synthesis beams of the CO and SO data are represented by the black and cyan ellipses at the lower left corner, respectively.
Current usage metrics show cumulative count of Article Views (full-text article views including HTML views, PDF and ePub downloads, according to the available data) and Abstracts Views on Vision4Press platform.
Data correspond to usage on the plateform after 2015. The current usage metrics is available 48-96 hours after online publication and is updated daily on week days.
Initial download of the metrics may take a while.