Fig. 14
Download original image
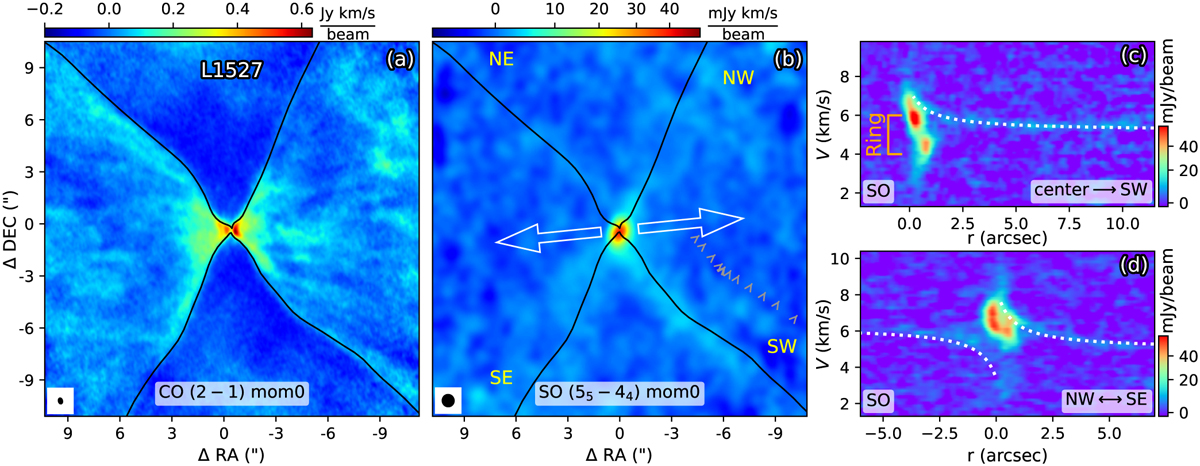
a: moment 0 map of CO (2-1) of L1527. The integration range is 0.8–11.6 km s–1. The beam size is shown as black ellipse at the lower left corner. The black lines mark the boundaries of CO outflows, b: moment 0 map of SO, cleaned using the natural weighting (Sect. 2.1.1). To improve the S/N, we have further smoothed the map to a beam size of 0.7″, as indicated by the black ellipse in the lower left corner. The white arrows mark the outflows. The black lines have the same meaning as in the left panel, and are denoted as SW, SE, NW and NE, accordingly to their locations, c and d: PV maps of SO along the outflow boundaries marked in the lower right corners. The dotted white lines represent the fitting results of the trajectories of free-fall streams in PV space (Sect. 3.3.3). See Figs. El and F.2 for the typical spectra of SO along the outflow boundaries.
Current usage metrics show cumulative count of Article Views (full-text article views including HTML views, PDF and ePub downloads, according to the available data) and Abstracts Views on Vision4Press platform.
Data correspond to usage on the plateform after 2015. The current usage metrics is available 48-96 hours after online publication and is updated daily on week days.
Initial download of the metrics may take a while.