Fig. 16
Download original image
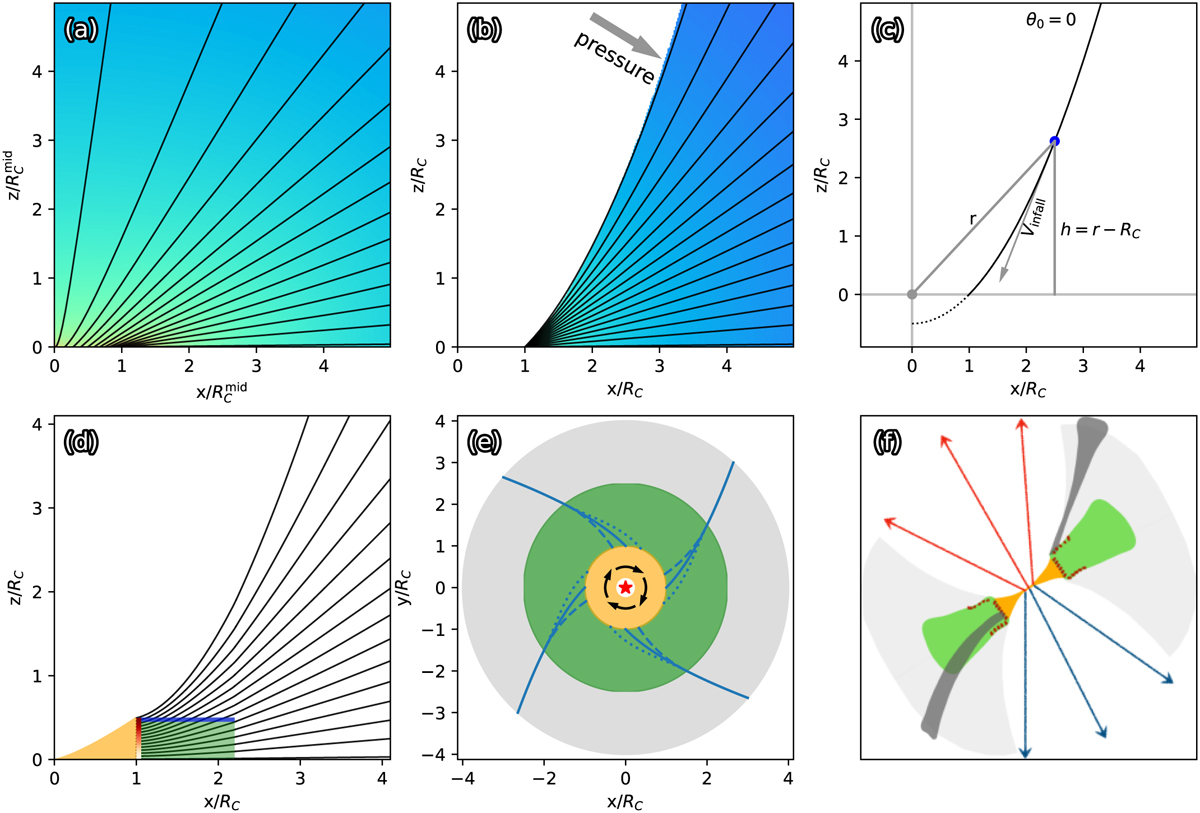
a: density distribution of the Ulrich (1976) model of the envelope. The black lines are the streamlines, b: same as the first panel but for the constant-J case (Sect. 4.2.1). c: streamline for θ0 = 0 in the constant-J case. Note that ρ depends only on r in the colored region, d: streamlines altered by disk-like inner envelope. The green area represents the disk-like envelope supported by thermal pressure and confined by shocks at the surface (Sect. 4.2.2). The orange area shows the schematic diagram of a Keplerian disk within the centrifugal barrier at RC, with a flare index of 1.3 (e.g., Chiang & Goldreich 1997). The vertical orange-red bar shows the head-on strong shocks at the centrifugal barrier (redder color means stronger shocks). The horizontal blue bar roughly represents the shocked surface of the envelope due to oblique flows, e: streamlines in the envelope viewed from the pole. The gray and yellow regions represent the outer and inner envelopes, respectively. The solid blue line depicts the free-fall parabolic trajectory in the midplane. The dotted and dashed lines are the pressure-modified trajectories in the midplane and on the surface of the inner envelope, respectively, f: schematic map in edge-on view. The gray, green, and orange regions are the outer envelope, disk-like envelope, and the disk, respectively. The black strips are the near-middle-plane (lower left) and off-midplane (upper right) streamers. The arrows indicate the outflows. The red dots highlight the shocked surfaces of the disk-like envelopes.
Current usage metrics show cumulative count of Article Views (full-text article views including HTML views, PDF and ePub downloads, according to the available data) and Abstracts Views on Vision4Press platform.
Data correspond to usage on the plateform after 2015. The current usage metrics is available 48-96 hours after online publication and is updated daily on week days.
Initial download of the metrics may take a while.