Open Access
Fig. 17
Download original image
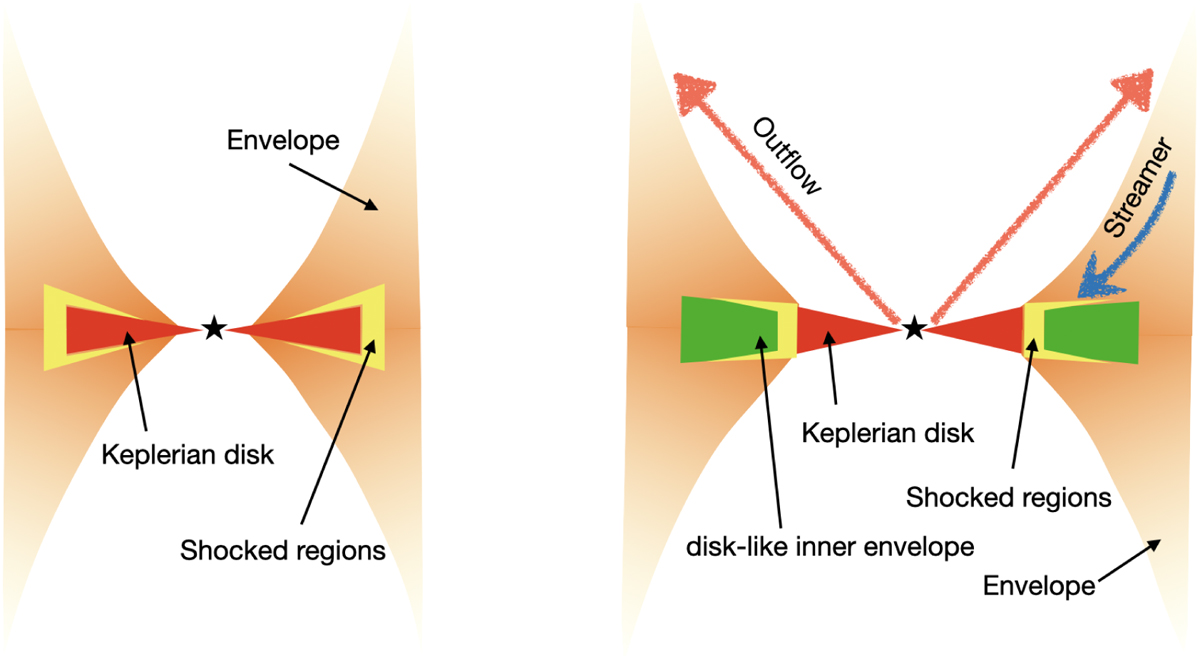
Schematic maps of the CMU model (left; see Sect. 4.1) and the updated model presented in this work (right; see Sects. 4.2.1, 4.2.2, and 4.2.3). The right panel provides similar information to panel f of Fig. 16, but emphasizes a comparison between the locations of the shocked regions in the updated model and the CMU model.
Current usage metrics show cumulative count of Article Views (full-text article views including HTML views, PDF and ePub downloads, according to the available data) and Abstracts Views on Vision4Press platform.
Data correspond to usage on the plateform after 2015. The current usage metrics is available 48-96 hours after online publication and is updated daily on week days.
Initial download of the metrics may take a while.