Open Access
Fig. B.1
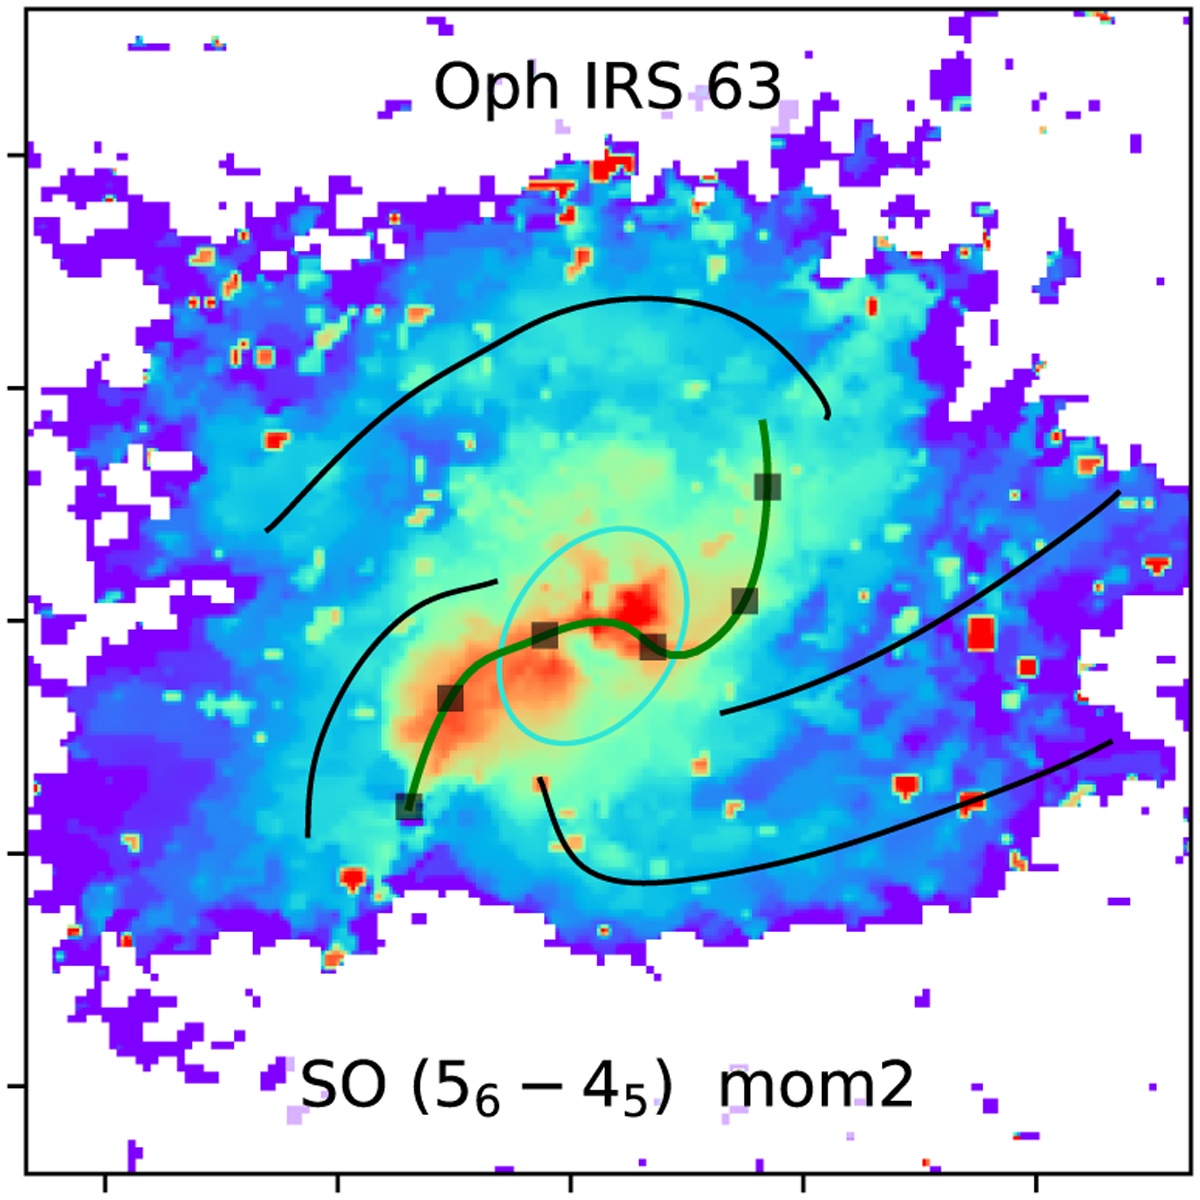
Download original image
Moment 2 map of SO (56−45) toward Oph IRS 63, similar to panel (b) of Fig. 2. The green line along the black boxes marks the S-shaped feature observed in the moment 2 map. The black boxes indicate an angular separation of 0.5″, starting from the most bottom left one.
Current usage metrics show cumulative count of Article Views (full-text article views including HTML views, PDF and ePub downloads, according to the available data) and Abstracts Views on Vision4Press platform.
Data correspond to usage on the plateform after 2015. The current usage metrics is available 48-96 hours after online publication and is updated daily on week days.
Initial download of the metrics may take a while.