Fig. 2
Download original image
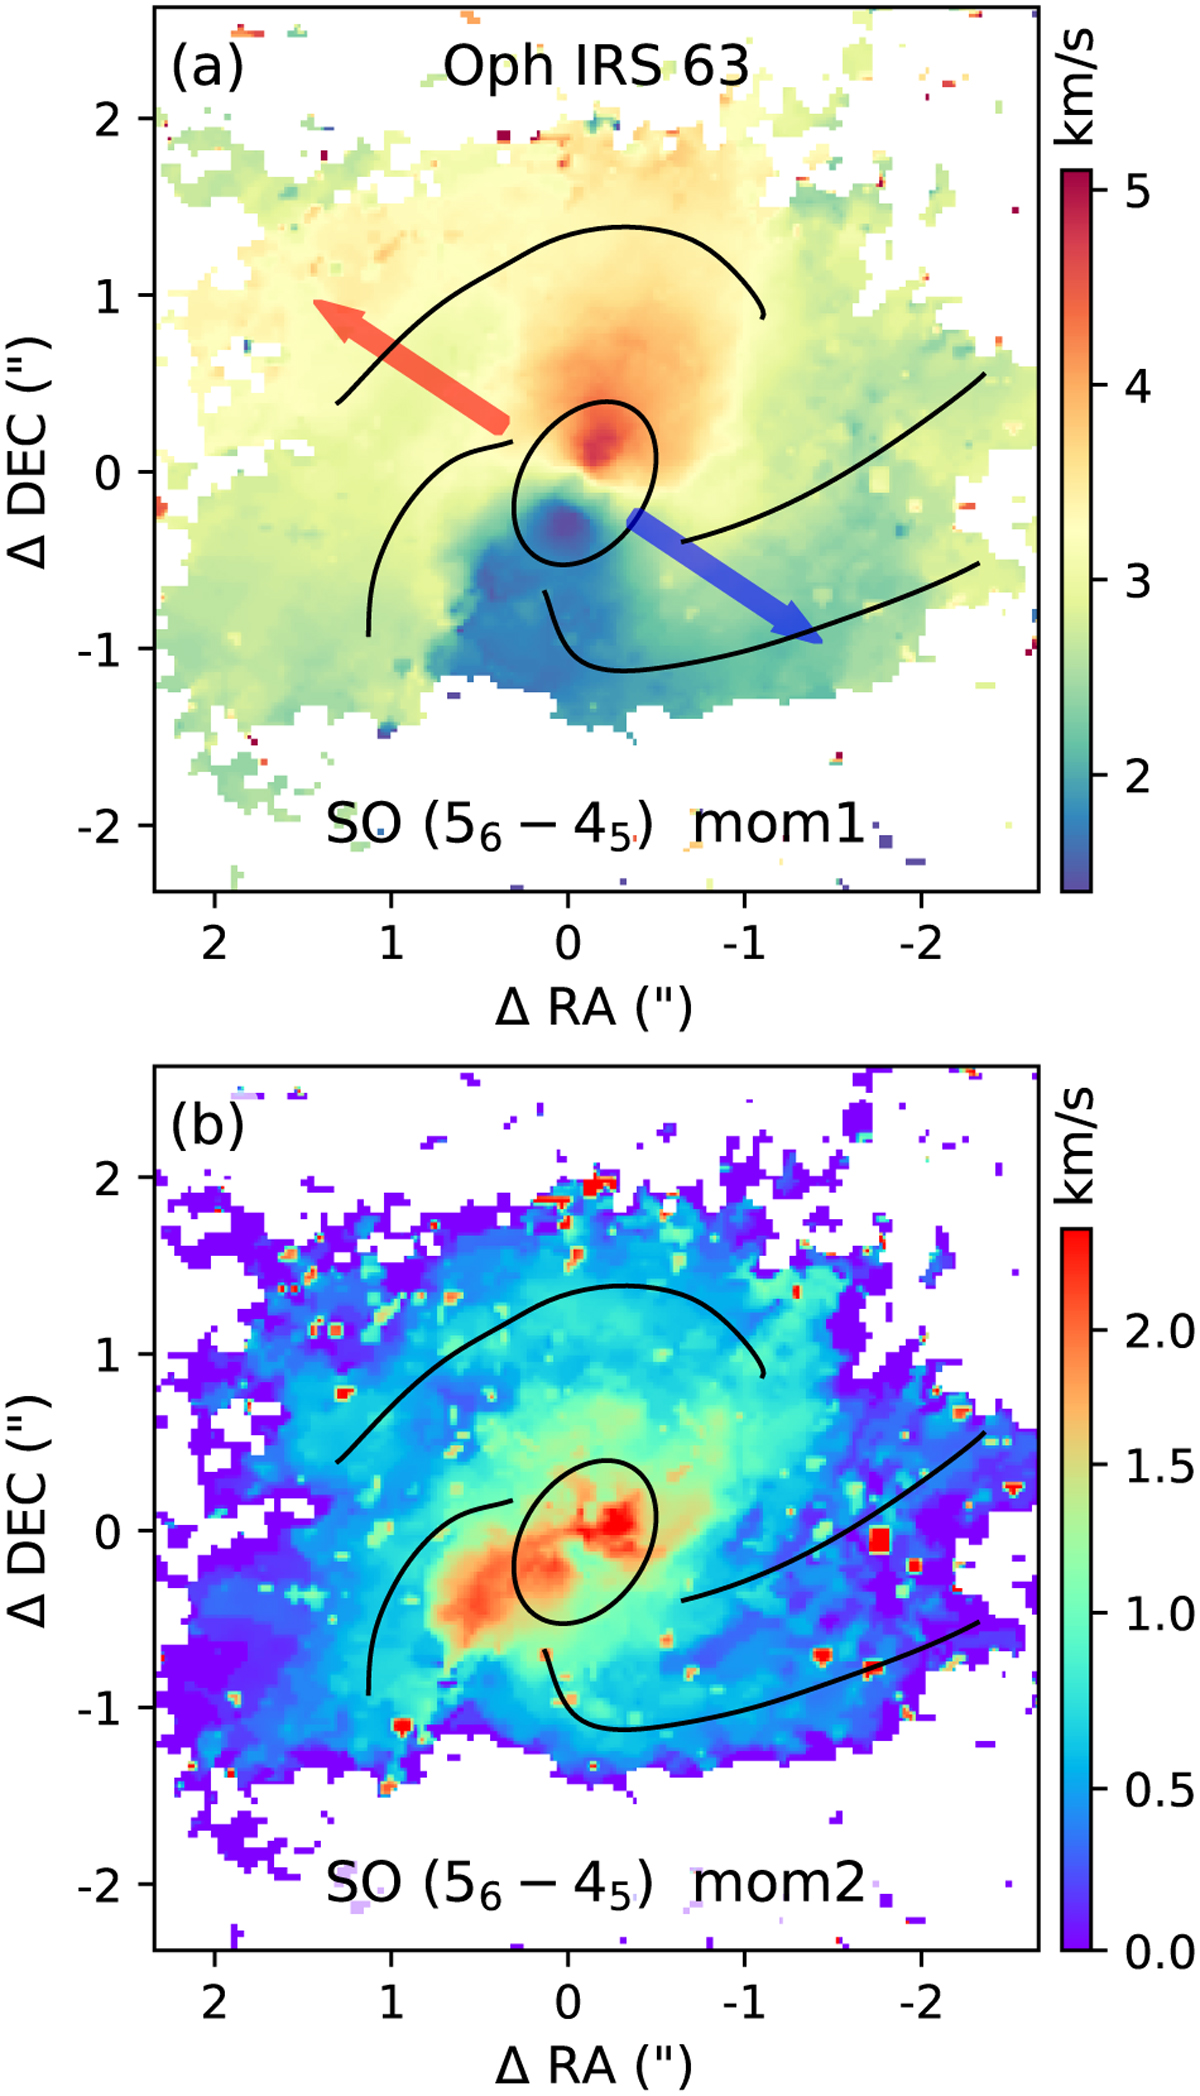
Moment 1 (panel a) and moment 2 (panel b) maps of SO (56 – 45) toward Oph IRS 63. In panel a, the directions of the red and blue outflows (Flores et al. 2023) are indicated by the arrows in the corresponding colors. In panel b, the original moment 2 map has been multiplied by a factor of ![]() and should be interpreted as the line width. The black ellipse and curves denote the SO rings and spiral structures (Fig. 1).
and should be interpreted as the line width. The black ellipse and curves denote the SO rings and spiral structures (Fig. 1).
Current usage metrics show cumulative count of Article Views (full-text article views including HTML views, PDF and ePub downloads, according to the available data) and Abstracts Views on Vision4Press platform.
Data correspond to usage on the plateform after 2015. The current usage metrics is available 48-96 hours after online publication and is updated daily on week days.
Initial download of the metrics may take a while.