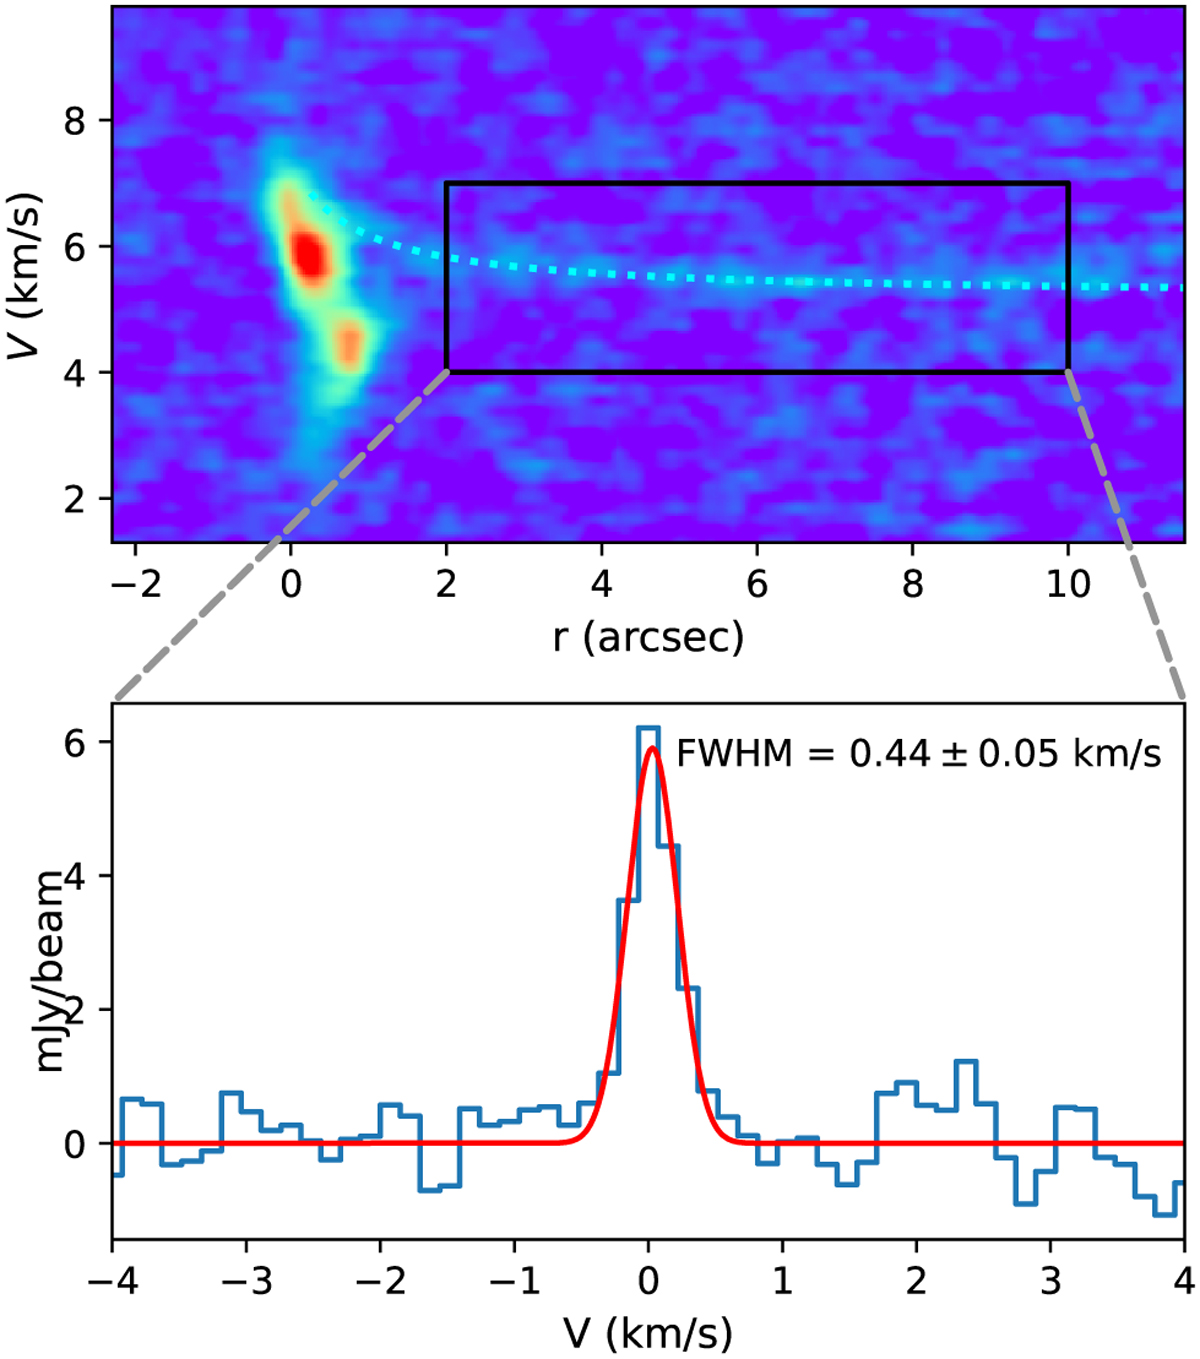
Fig. F.1
Download original image
Upper: PV map of SO emission along the SW direction (same as Fig. 14(c)). Lower: Averaged spectrum (velocity centers of spectra at different r have been corrected for better alignment; see Appendix F for details) of the region enclosed by the black rectangle in the upper panel. The red line shows the Gaussian fit, and the fitted linewidth (FWHM) is labeled.
Current usage metrics show cumulative count of Article Views (full-text article views including HTML views, PDF and ePub downloads, according to the available data) and Abstracts Views on Vision4Press platform.
Data correspond to usage on the plateform after 2015. The current usage metrics is available 48-96 hours after online publication and is updated daily on week days.
Initial download of the metrics may take a while.