Fig. F.2
Download original image
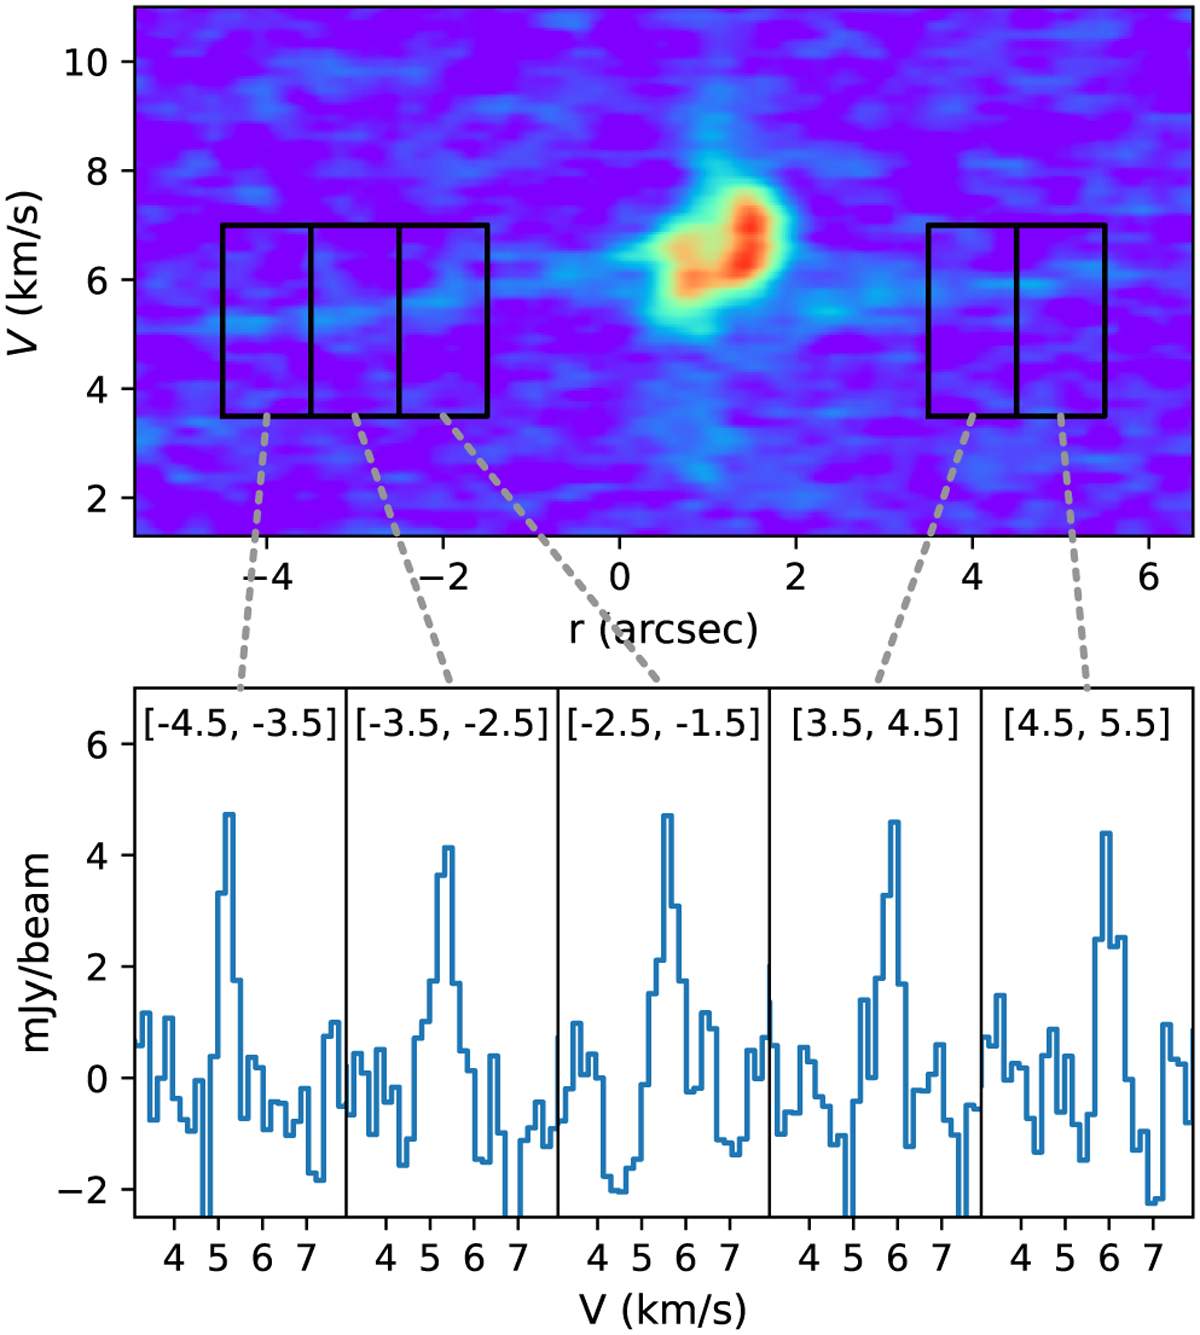
Upper: PV map of SO emission along the SE and NW directions (same as Fig. 14(d)). Lower: Stacked spectra averaged over different intervals of r, as indicated by the black rectangles in the upper panel. The corresponding intervals are also labeled on the individual spectra. Since the intervals are short, no velocity correction is applied here, unlike in Fig. F.1.
Current usage metrics show cumulative count of Article Views (full-text article views including HTML views, PDF and ePub downloads, according to the available data) and Abstracts Views on Vision4Press platform.
Data correspond to usage on the plateform after 2015. The current usage metrics is available 48-96 hours after online publication and is updated daily on week days.
Initial download of the metrics may take a while.