Fig. 3
Download original image
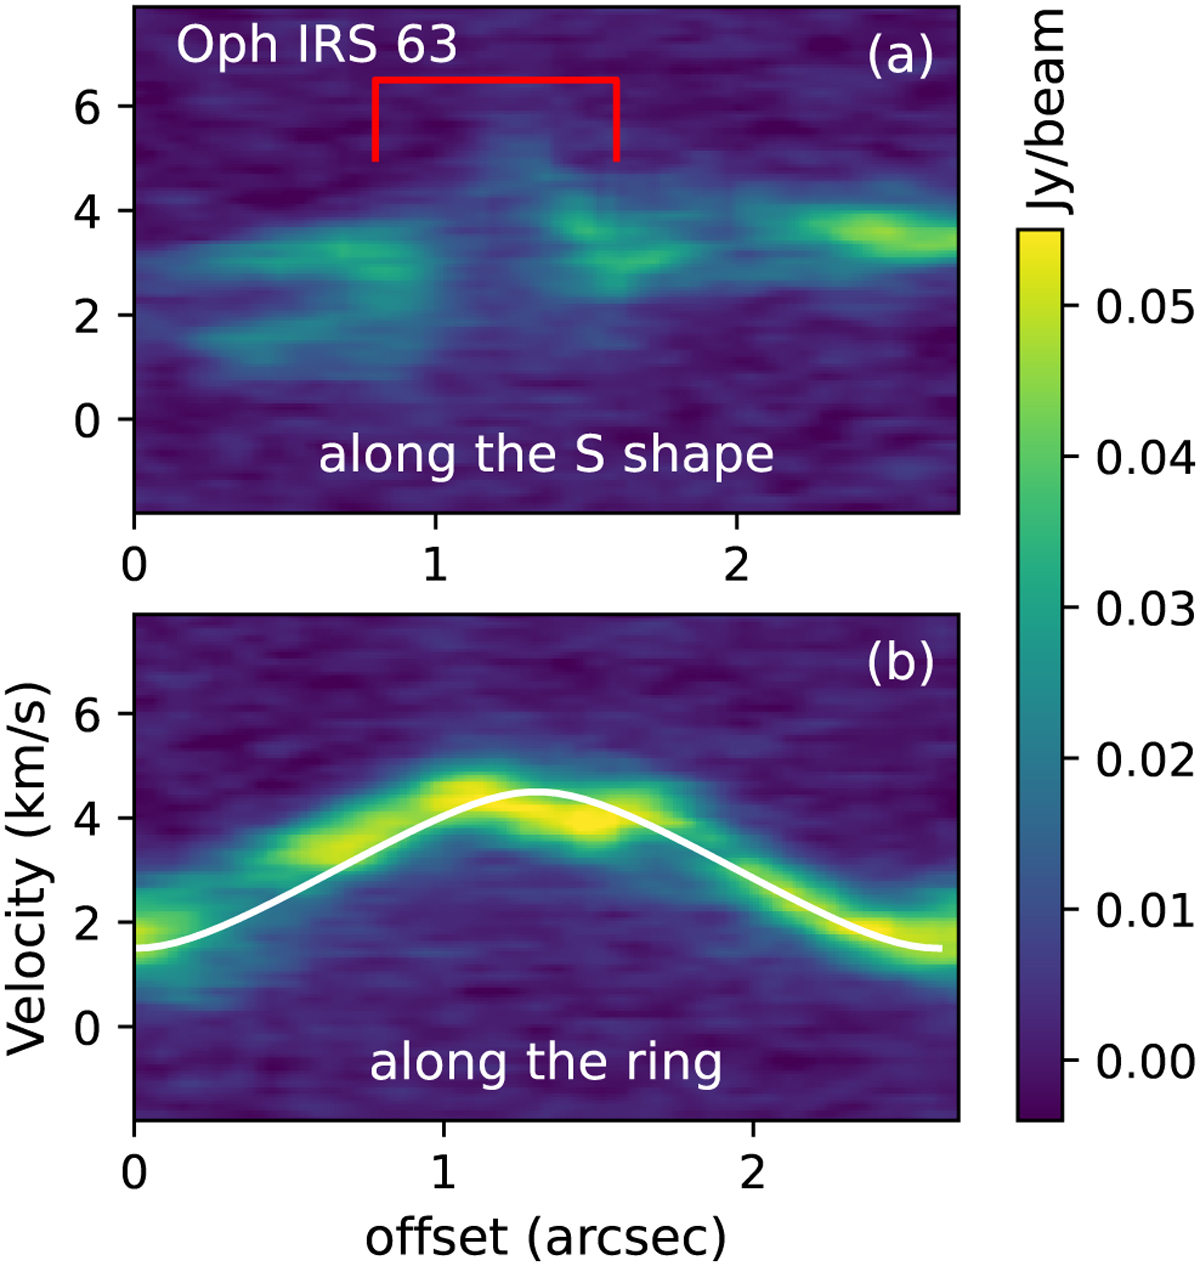
a: PV map of SO along the S-shaped structure observed in the moment maps shown in Fig. 2 (see Fig. B.1 for the implicit marking of the S-shape). The red line marks the location of the SO ring, b: PV map of SO along the sulfur ring (Fig. 1). The white line represents the modeled PV curve of a rotating ring, calculated using Eqs. (D.4) and (D.5). See Sect. 3.1.1 for the fitting results.
Current usage metrics show cumulative count of Article Views (full-text article views including HTML views, PDF and ePub downloads, according to the available data) and Abstracts Views on Vision4Press platform.
Data correspond to usage on the plateform after 2015. The current usage metrics is available 48-96 hours after online publication and is updated daily on week days.
Initial download of the metrics may take a while.