Fig. 8
Download original image
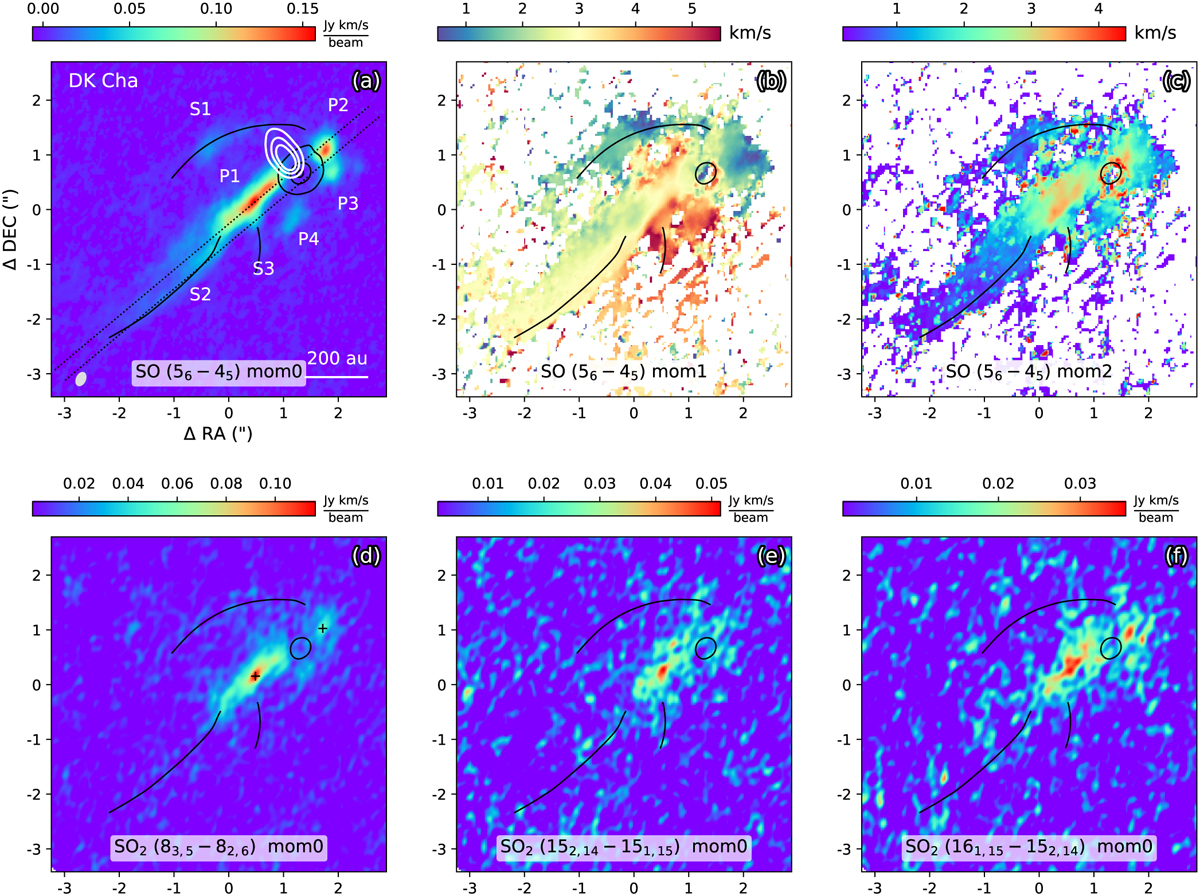
Moment maps of SO and SO2 for DK Cha. The transition quantum labels are provided at the bottom of each panel, and the beam is indicated in the lower left corner of the first panel. In panel a, the black contours represent the ALMA continuum emission at levels of [0.01, 0.5, 0.9] times the peak value (0.16 Jy beam–1 ). In the other panels, only the 0.5 times the peak value contour of the ALMA continuum is shown. The white contours in the first panel outline the north-east lobe of the outflow, as traced by [S II] 6731 Å using VLT/MUSE. This outflow has been smoothed to match the resolution of the ALMA data. The white contour levels are [0.3, 0.5, 0.7] times the peak value. Substructures identified in the moment 0 map of SO are labeled in the upper left panel, with three streamers (S1 to S3) marked by black curves. For an illustration of additional substructures, their names, and connections, refer to the schematic image in Fig. 12. As in panel b of Fig. 2, the moment 2 map of SO in this figure has been multiplied by a factor of ![]() . In panel d, the two black crosses indicate the positions used to extract the rotation diagrams shown in Fig. 10. The center of the shown region is located at RA (J2000) = 12h53m17.45s, Dec (J2000) = –77d07m11.5s, which does not coincide with the protostar’s location.
. In panel d, the two black crosses indicate the positions used to extract the rotation diagrams shown in Fig. 10. The center of the shown region is located at RA (J2000) = 12h53m17.45s, Dec (J2000) = –77d07m11.5s, which does not coincide with the protostar’s location.
Current usage metrics show cumulative count of Article Views (full-text article views including HTML views, PDF and ePub downloads, according to the available data) and Abstracts Views on Vision4Press platform.
Data correspond to usage on the plateform after 2015. The current usage metrics is available 48-96 hours after online publication and is updated daily on week days.
Initial download of the metrics may take a while.