Fig. 2
Download original image
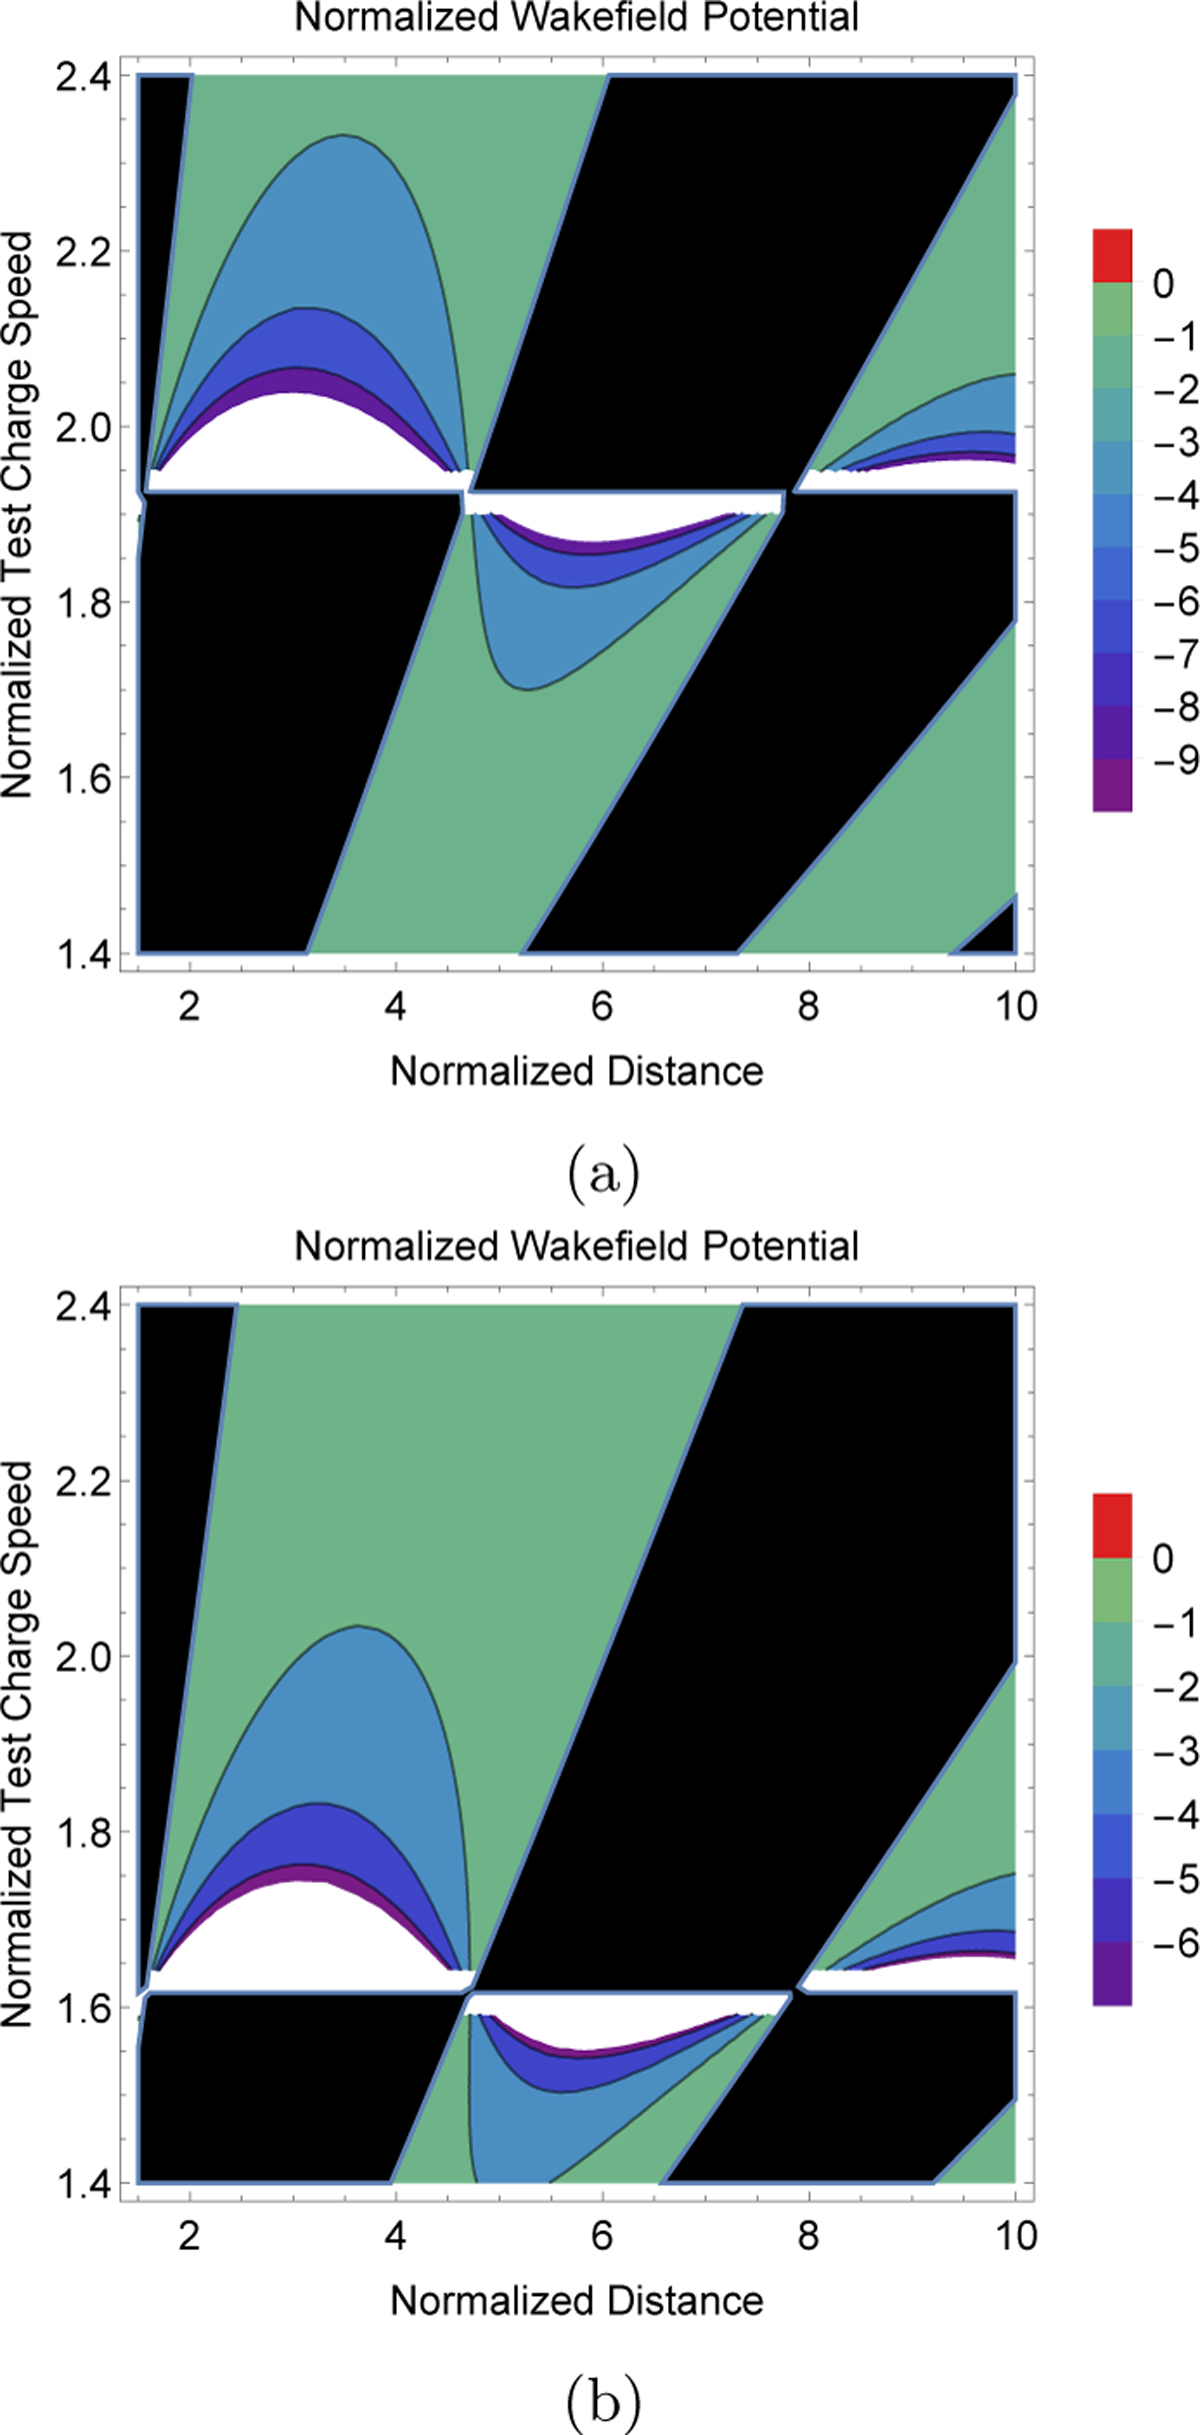
Contour plot of the normalized wakefield potential against the normalized axial distance (z/λD). Panel a shows minimum values, and panel b shows maximum values of the plasma system parameters (see Table 1). In these panels, the attractive potential is represented by the colored regions, whereas the repulsive potential is represented by the black regions.
Current usage metrics show cumulative count of Article Views (full-text article views including HTML views, PDF and ePub downloads, according to the available data) and Abstracts Views on Vision4Press platform.
Data correspond to usage on the plateform after 2015. The current usage metrics is available 48-96 hours after online publication and is updated daily on week days.
Initial download of the metrics may take a while.