Fig. 8
Download original image
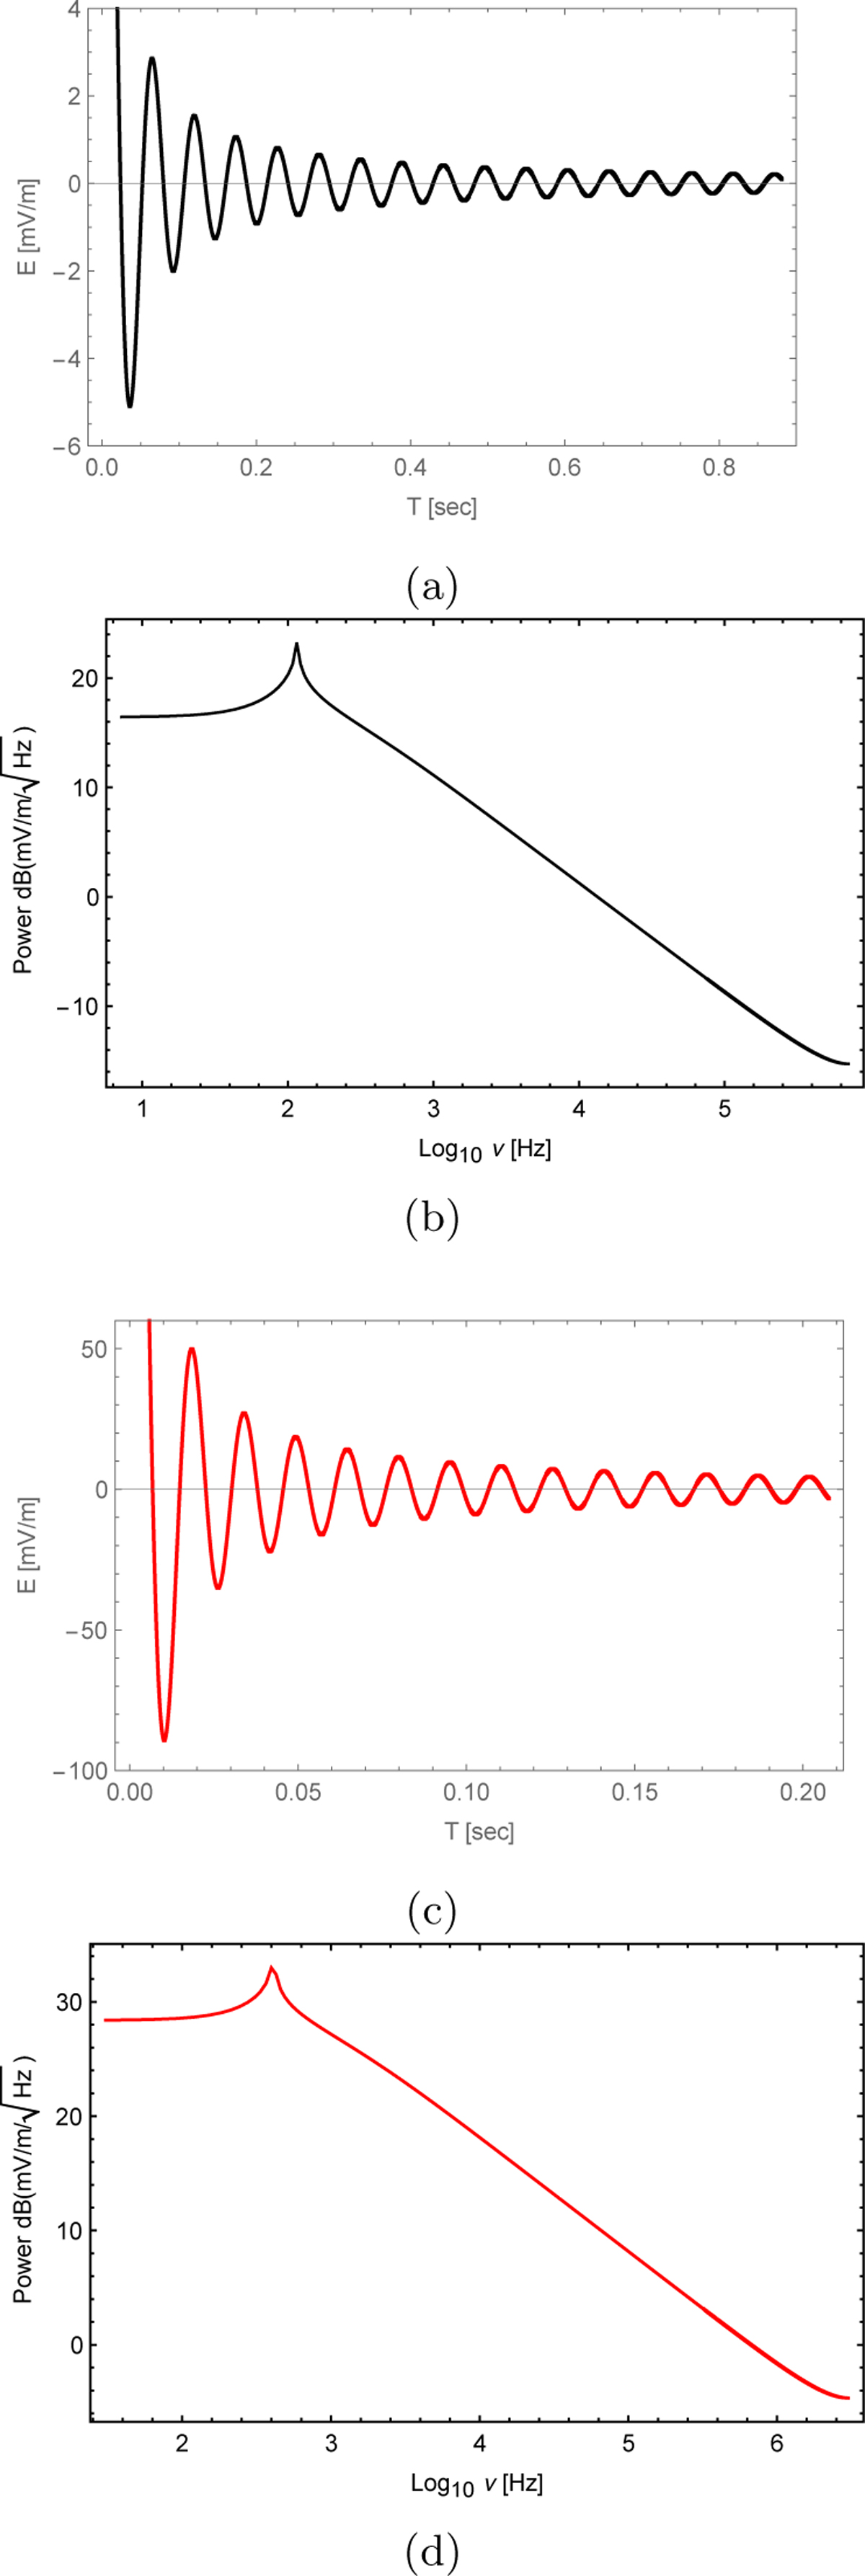
(a) Electric field profile for minimum values of the plasma system parameters (see Table 1) and (b) the FFT power spectra of the electric field. (c) Electric field profile for maximum values of the plasma system parameters (see Table 1). (d) Corresponding FFT power spectra of the electric field. The x-axis signifies the log10 ν, where v is the frequency in Hz, and the y-axis represents the power of the electric field in units of dB(mV/m/Hz).
Current usage metrics show cumulative count of Article Views (full-text article views including HTML views, PDF and ePub downloads, according to the available data) and Abstracts Views on Vision4Press platform.
Data correspond to usage on the plateform after 2015. The current usage metrics is available 48-96 hours after online publication and is updated daily on week days.
Initial download of the metrics may take a while.