Fig. 1.
Download original image
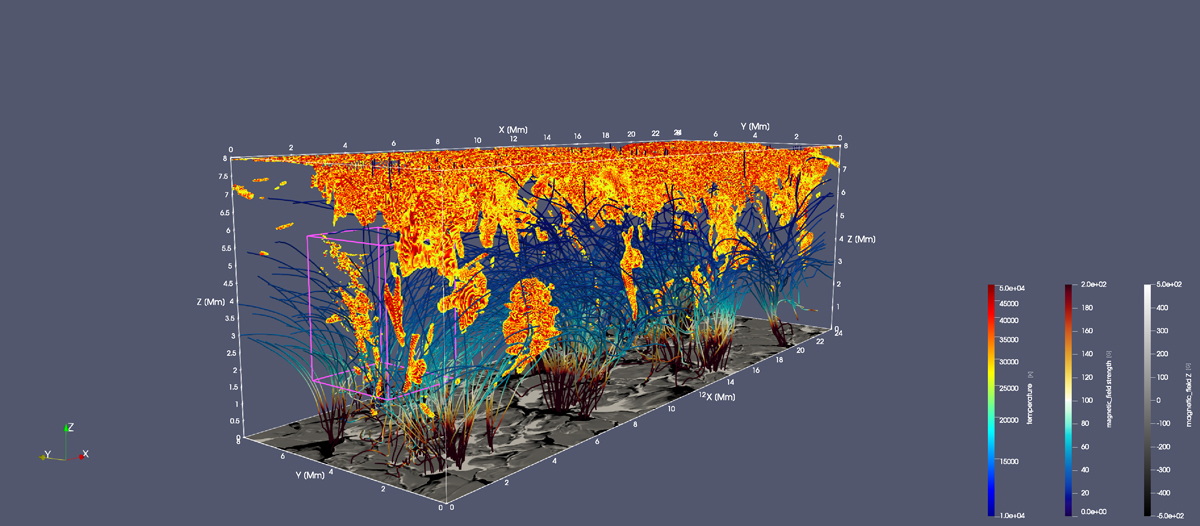
Three-dimensional overview of the simulation domain above the photosphere at t = 4414 s. The colored line structures represent the magnetic field lines in the simulation area, with colors corresponding to the field strengths. The grayscale slice at the bottom illustrates the distribution of the longitudinal magnetic field at the solar surface. Yellow and red isosurfaces represent the regions where temperatures are above 20 000 K. The purple box represents the region of interest. More details can be found in the supplementary online.
Current usage metrics show cumulative count of Article Views (full-text article views including HTML views, PDF and ePub downloads, according to the available data) and Abstracts Views on Vision4Press platform.
Data correspond to usage on the plateform after 2015. The current usage metrics is available 48-96 hours after online publication and is updated daily on week days.
Initial download of the metrics may take a while.