Open Access
Fig. 2.
Download original image
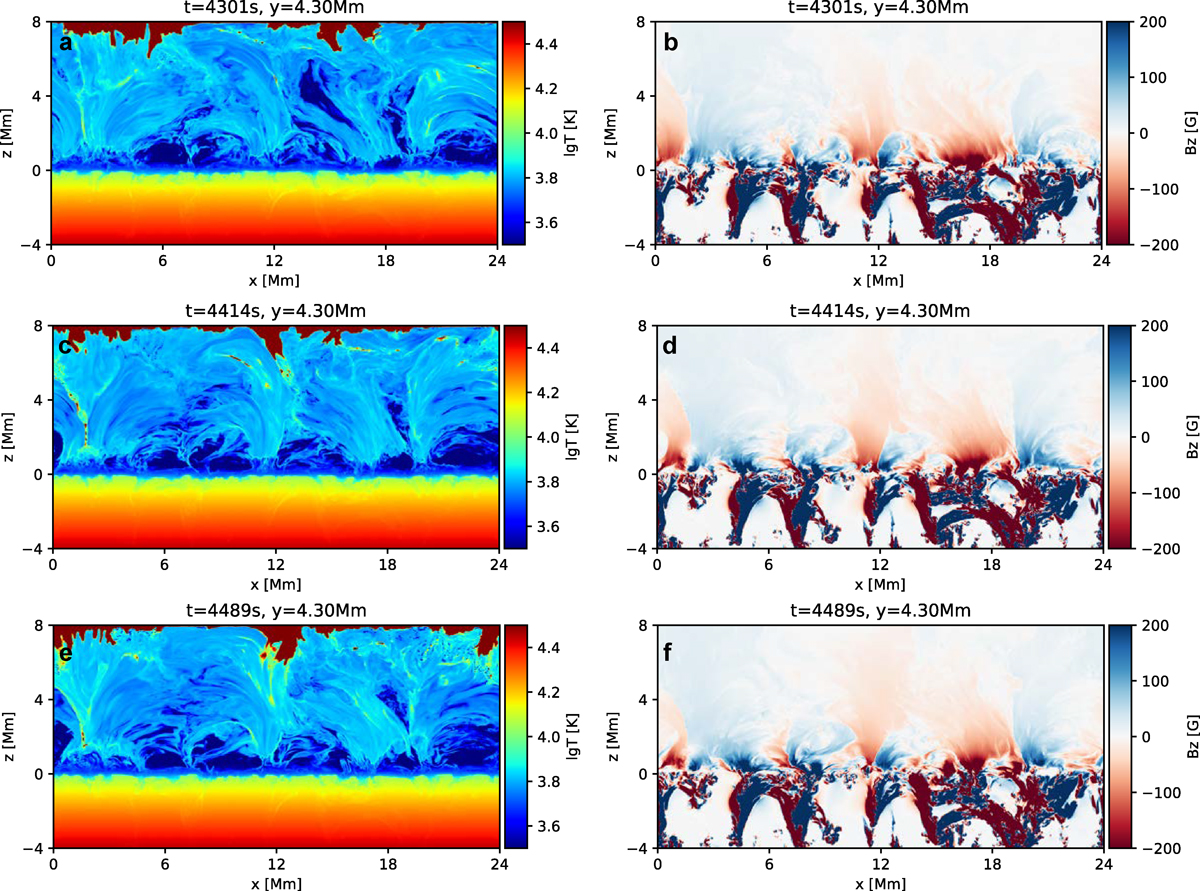
Slices at y = 4.3 Mm at three different times in the simulation. The left column displays the temperature distribution in the slice planes, while the right column shows the distribution of the magnetic field strength (Bz) perpendicular to the solar surface. More details can be found in the supplementary online.
Current usage metrics show cumulative count of Article Views (full-text article views including HTML views, PDF and ePub downloads, according to the available data) and Abstracts Views on Vision4Press platform.
Data correspond to usage on the plateform after 2015. The current usage metrics is available 48-96 hours after online publication and is updated daily on week days.
Initial download of the metrics may take a while.