Fig. 3.
Download original image
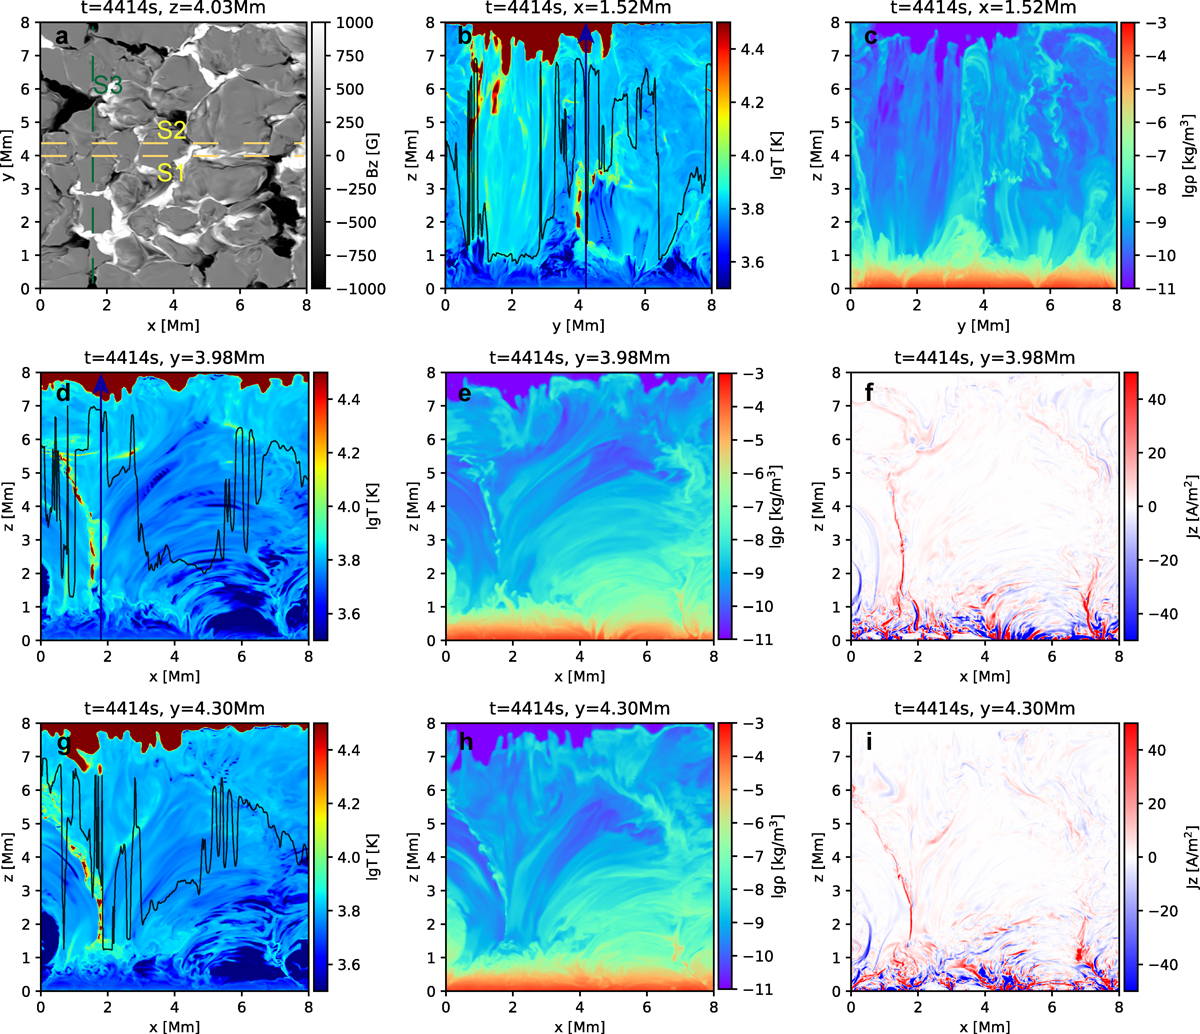
Slices along different directions at t = 4414 s in the simulation. Panel a illustrates the longitudinal magnetic field (Bz) at the solar surface, marked with dashed lines to indicate the positions of slices S1, S2, and S3. Panels b and c represent the temperature and density distributions along slice S3 within the y − z plane. Panels d to f and panels g to i respectively show the temperature, density, and current density (Jz) distributions along slices S1 and S2 in the x − z plane. The black curves in the figure indicate the height at which the Hα line center optical depth equals unity.
Current usage metrics show cumulative count of Article Views (full-text article views including HTML views, PDF and ePub downloads, according to the available data) and Abstracts Views on Vision4Press platform.
Data correspond to usage on the plateform after 2015. The current usage metrics is available 48-96 hours after online publication and is updated daily on week days.
Initial download of the metrics may take a while.