Open Access
Fig. 8.
Download original image
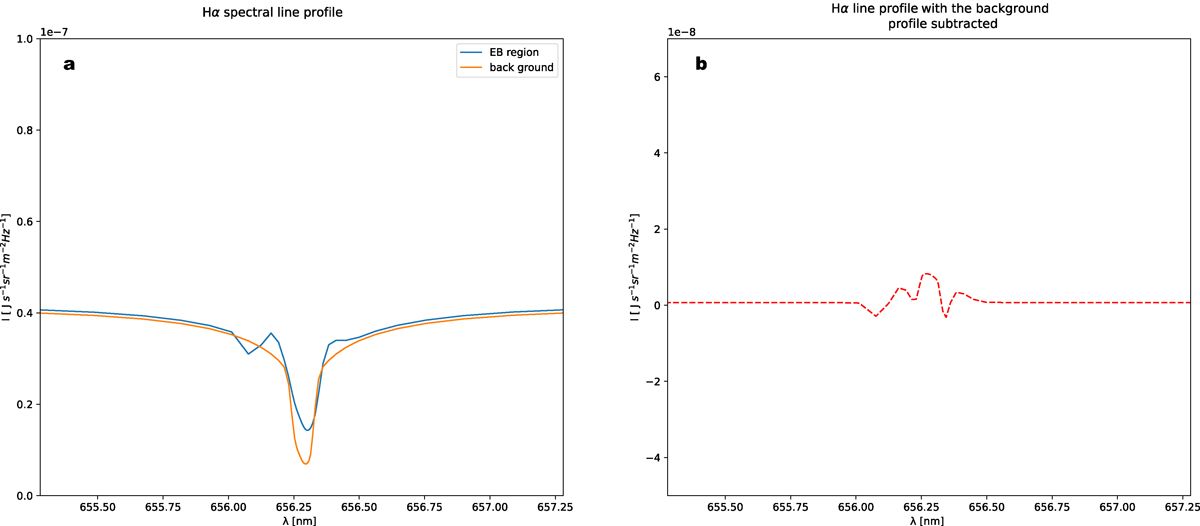
Hα spectral line profiles through the low-temperature plasma blob indicated by the blue arrows in Figs. 3a and d. Panel a shows the spectral line profile calculated using RH1.5D directly, and panel b shows the result after subtracting the background spectral line profile.
Current usage metrics show cumulative count of Article Views (full-text article views including HTML views, PDF and ePub downloads, according to the available data) and Abstracts Views on Vision4Press platform.
Data correspond to usage on the plateform after 2015. The current usage metrics is available 48-96 hours after online publication and is updated daily on week days.
Initial download of the metrics may take a while.