Fig. 9.
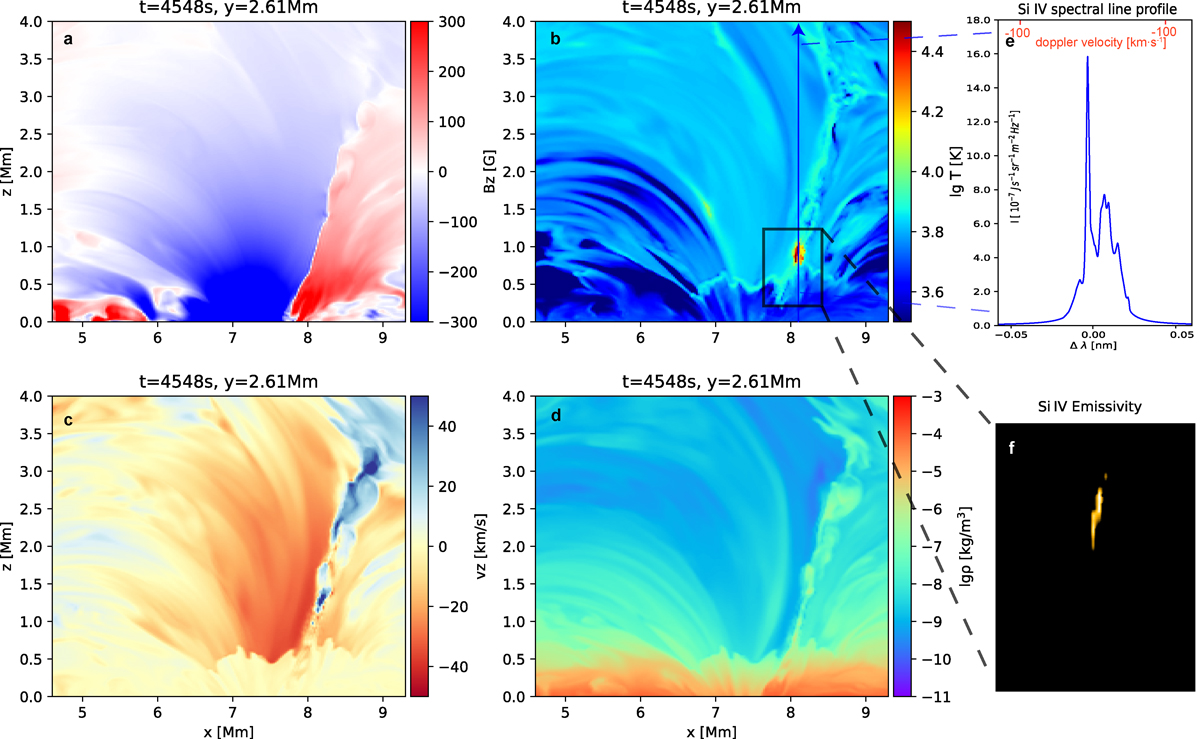
Download original image
Slices at t = 4548 s and y = 2.61 Mm of another reconnection event. The figure displays the distribution of the magnetic field in the z direction, temperature, velocity in the z direction (Vz), density, the synthesized Si IV spectral line profile, and the synthetic image of the high-temperature area in the Si IV band along the y direction.
Current usage metrics show cumulative count of Article Views (full-text article views including HTML views, PDF and ePub downloads, according to the available data) and Abstracts Views on Vision4Press platform.
Data correspond to usage on the plateform after 2015. The current usage metrics is available 48-96 hours after online publication and is updated daily on week days.
Initial download of the metrics may take a while.