Fig. 1.
Download original image
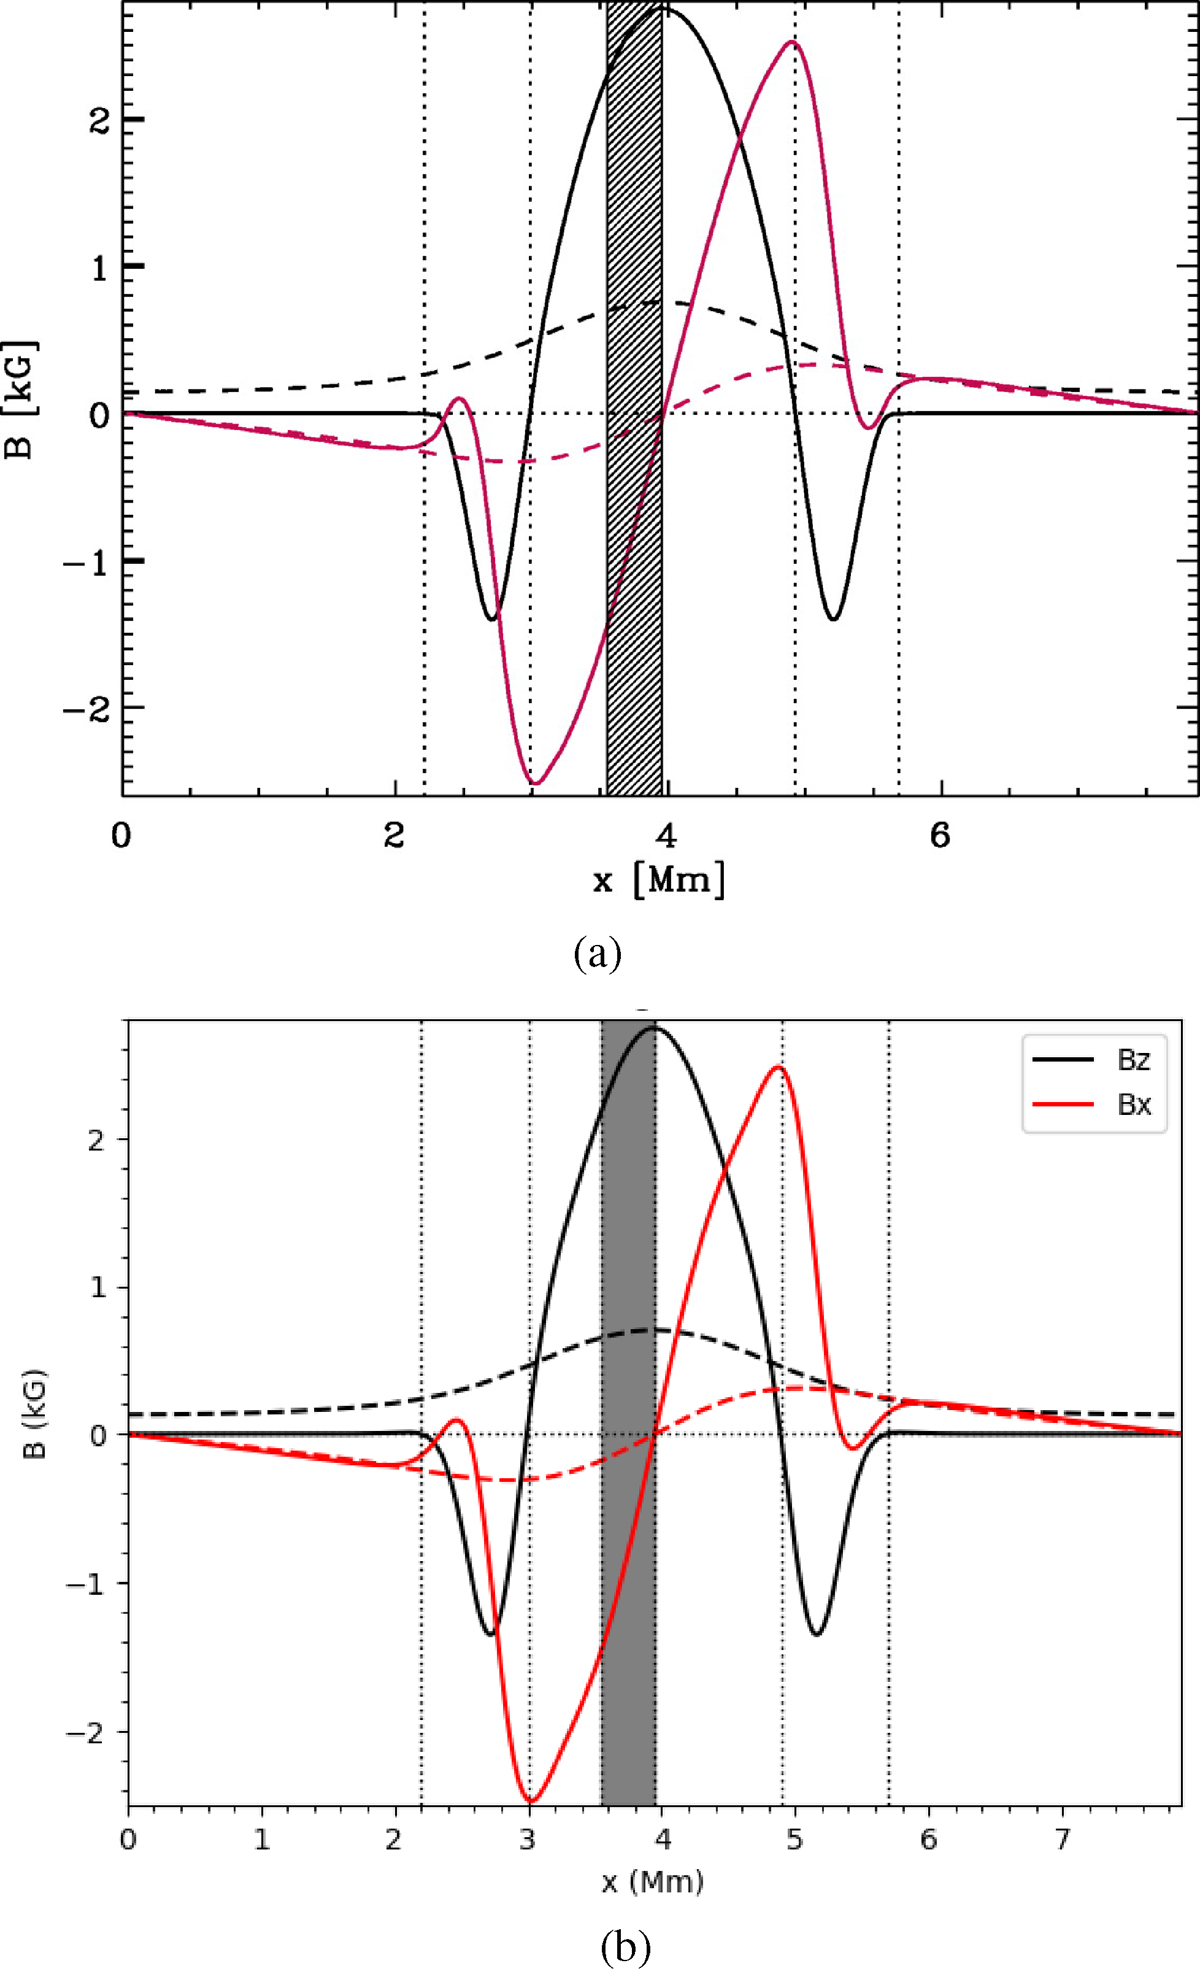
Initial distribution of the magnetic field strength in the original (top) and our Bifrost (bottom) simulation. The magnetic field is shown at two horizontal cuts of the computational domain: at the base (z = 0 Mm, solid lines) and top (z = 1.26 Mm, dashed lines). The black and red lines indicate the vertical (Bz) and horizontal (Bx) magnetic field strengths, respectively. The vertical dotted lines indicate the three different segments of Bz where the flux is either positive (∼2 Mm wide) or negative (∼750 km wide). The shaded area indicates the location of the 400 km wide piston. This plot is for the strong field case. For the weak field, the field strengths are divided by 4 everywhere.
Current usage metrics show cumulative count of Article Views (full-text article views including HTML views, PDF and ePub downloads, according to the available data) and Abstracts Views on Vision4Press platform.
Data correspond to usage on the plateform after 2015. The current usage metrics is available 48-96 hours after online publication and is updated daily on week days.
Initial download of the metrics may take a while.