Fig. 2.
Download original image
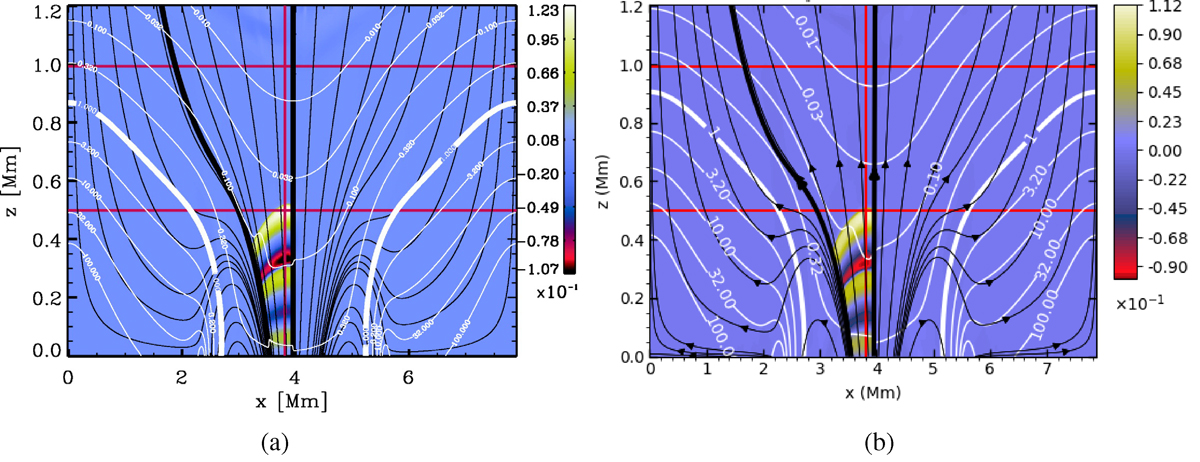
Comparison of u∥/c0 from the original simulation (left) and the Bifrost simulation (right) of at t = 58.5 s. The colour range is the same for the two figures. The thin black lines indicate random magnetic field lines where the two thick black lines indicate the magnetic field lines attached to the edges of the piston. The thin white lines indicate iso-plasma β contours labelled by their respective values. The thick white lines indicate the layer where β = 1. The red lines are reference lines, at (horizontal) z = 499 km, z = 933 km and (vertical) x = 3.81 Mm.
Current usage metrics show cumulative count of Article Views (full-text article views including HTML views, PDF and ePub downloads, according to the available data) and Abstracts Views on Vision4Press platform.
Data correspond to usage on the plateform after 2015. The current usage metrics is available 48-96 hours after online publication and is updated daily on week days.
Initial download of the metrics may take a while.