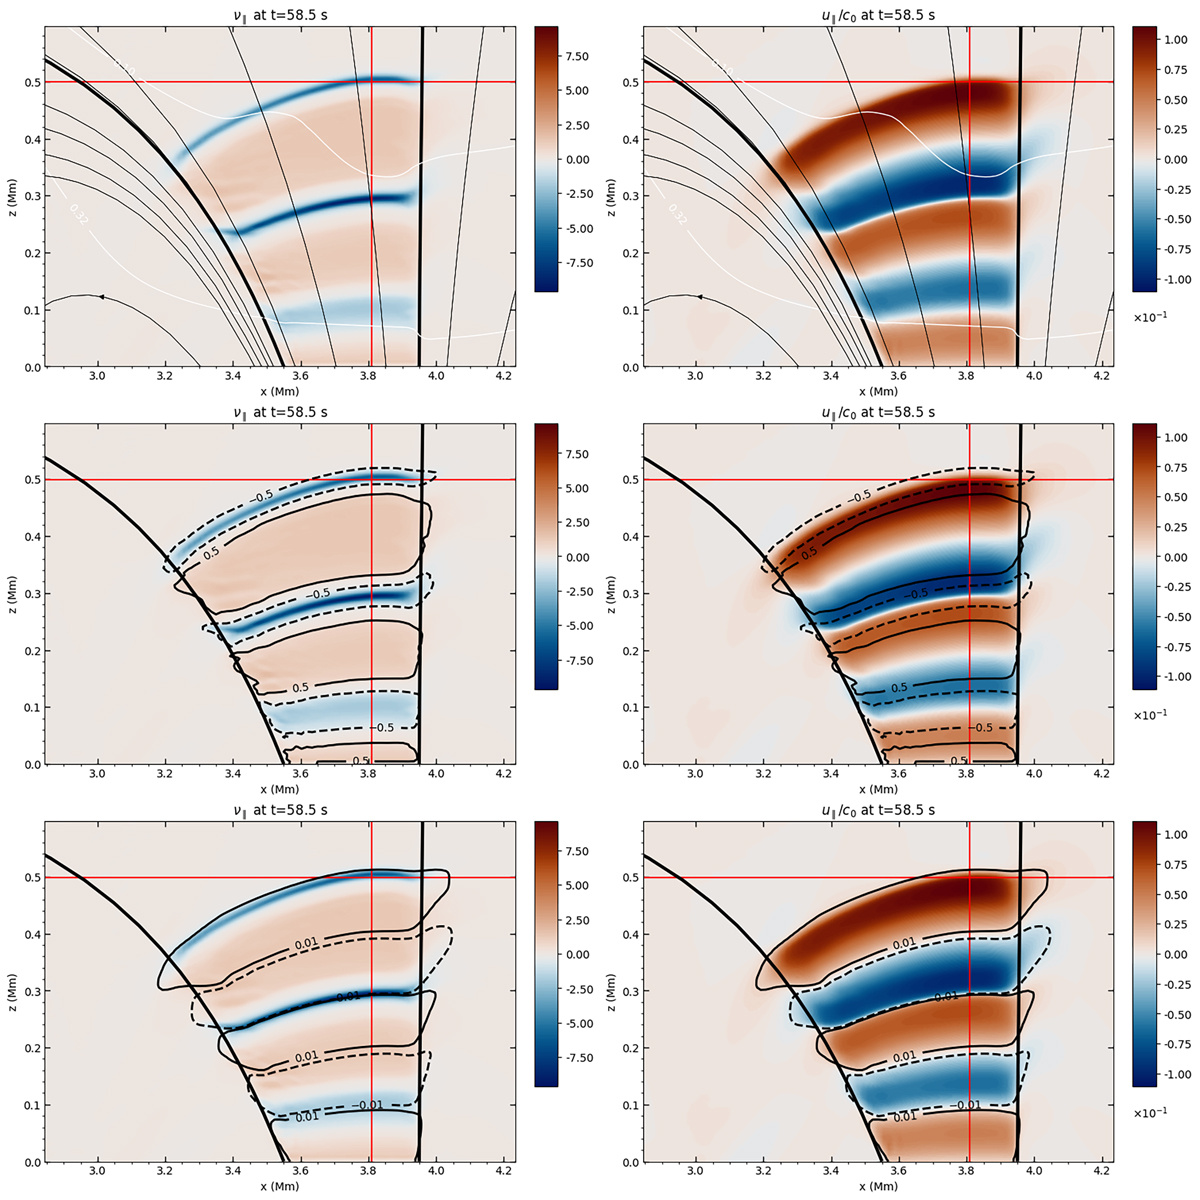
Fig. 3.
Download original image
ν∥ (left) and u∥/c0 (right) shown in the top panel for the strong field and radial driving case at t = 58.5 s. In the middle panel, both components are overplotted by black lines of ν∥ = ±0.5. In the bottom panel, both plots are overplotted by black lines of u∥/c0 = ±0.01. Red, black (non-contours) and white lines are as in Figure 2. Note: we have only kept the magnetic field lines anchored at the piston edges (black lines) and the β = 1 line for the two bottom plots for simplicity. We also note that the colour range is different for the two variables.
Current usage metrics show cumulative count of Article Views (full-text article views including HTML views, PDF and ePub downloads, according to the available data) and Abstracts Views on Vision4Press platform.
Data correspond to usage on the plateform after 2015. The current usage metrics is available 48-96 hours after online publication and is updated daily on week days.
Initial download of the metrics may take a while.