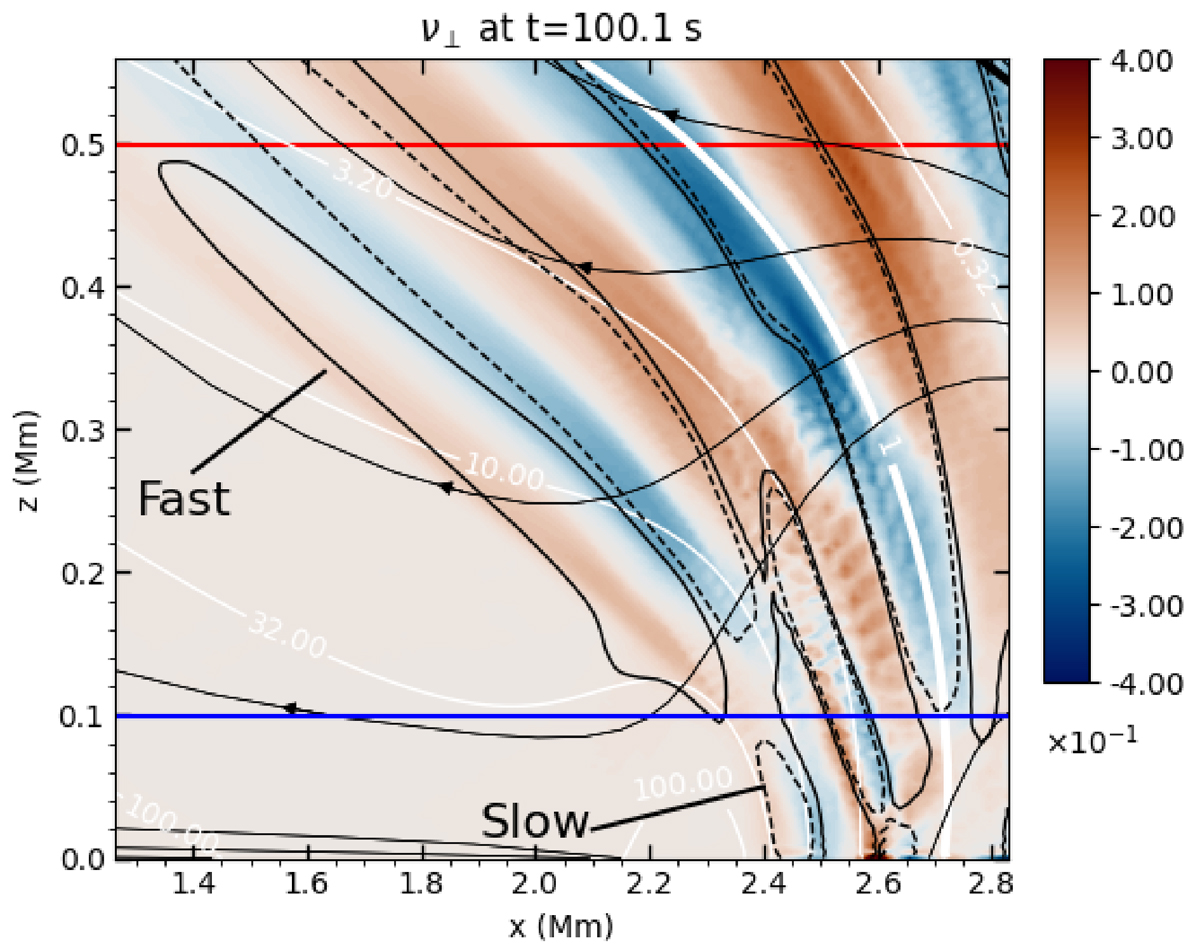
Fig. 6.
Download original image
Zoomed in cut of ν⊥ for the strong field and radial driving case after t = 101.1 seconds. Black lines of u⊥/c0 = ±0.001 are overplotted to indicate the location of positive and negative areas of u⊥/c0 (same format as bottom left panel in Figure 3). Red, black (non-contour) and white lines are as in Figure 2. The blue horizontal line indicates the line through which we take the time-distance plot in Figure 8.
Current usage metrics show cumulative count of Article Views (full-text article views including HTML views, PDF and ePub downloads, according to the available data) and Abstracts Views on Vision4Press platform.
Data correspond to usage on the plateform after 2015. The current usage metrics is available 48-96 hours after online publication and is updated daily on week days.
Initial download of the metrics may take a while.