Fig. 7.
Download original image
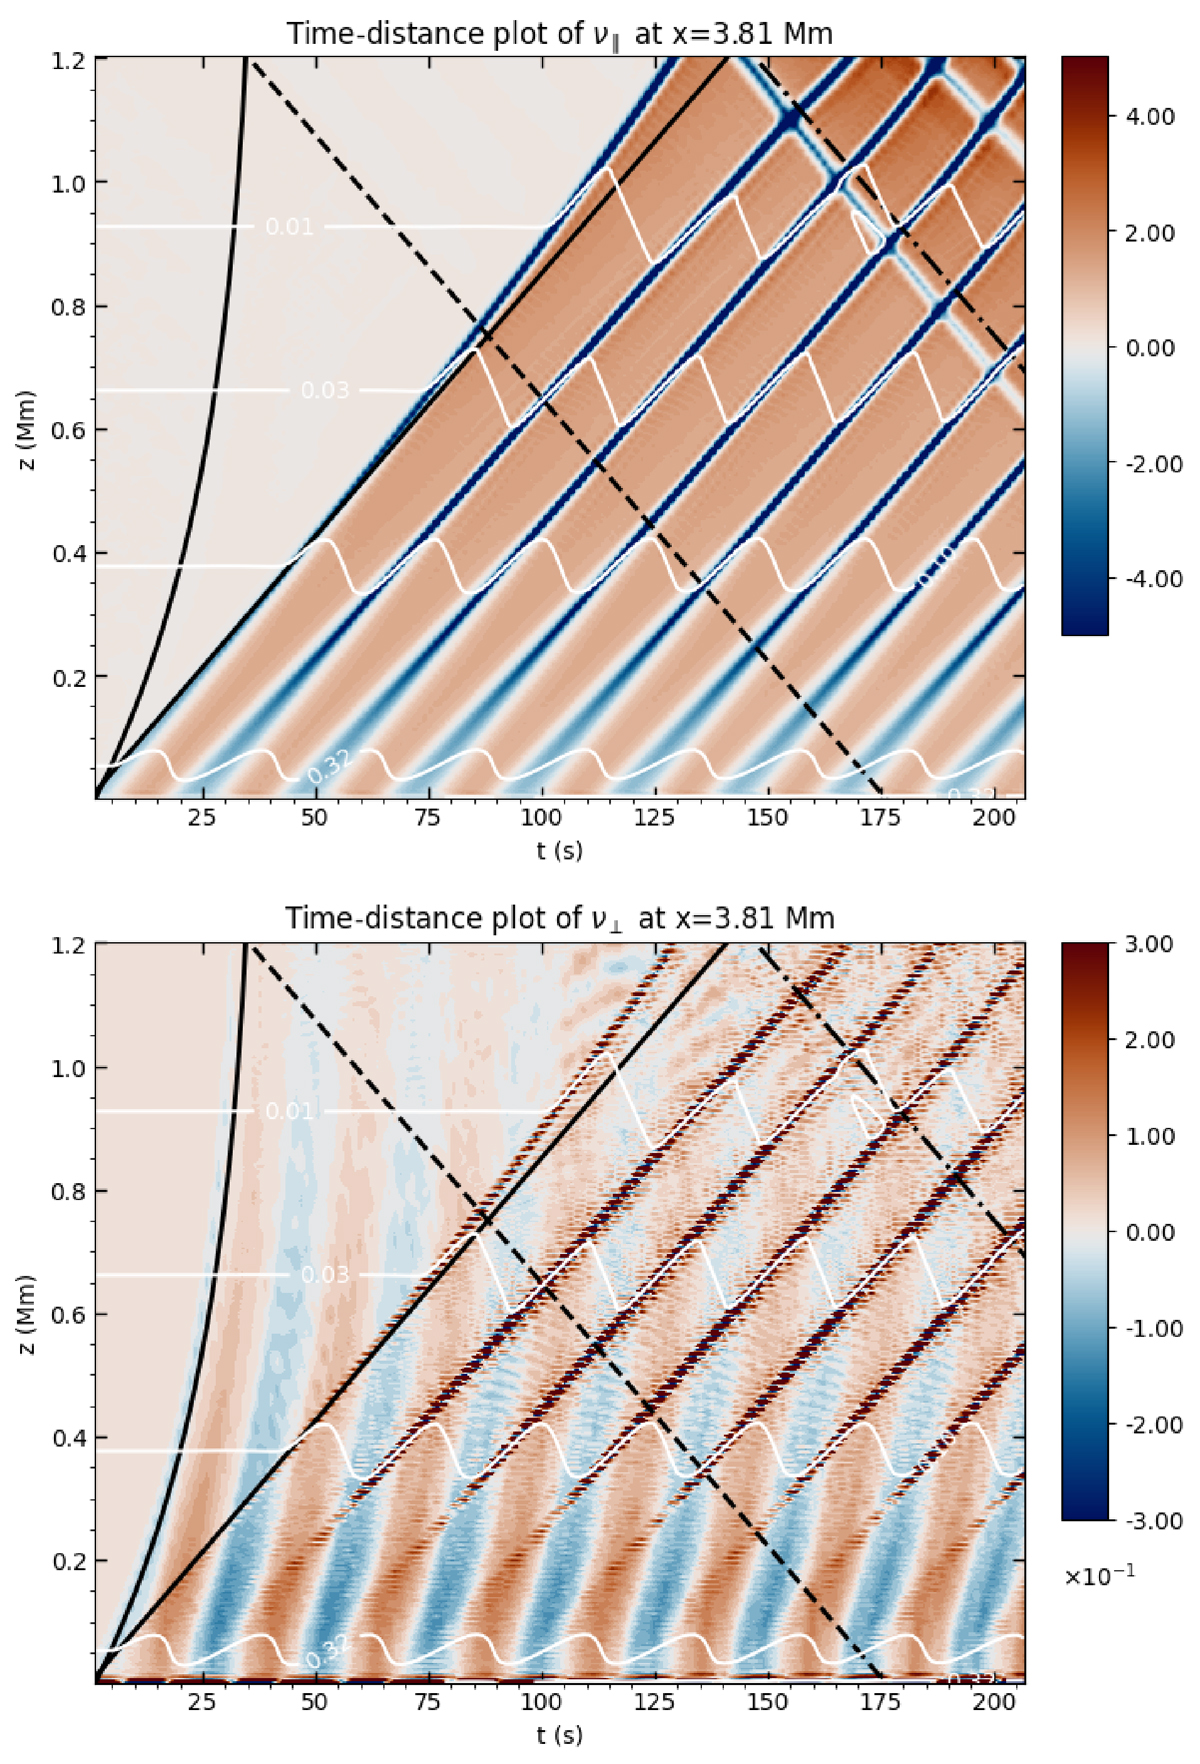
Time-distance plots of ν∥ (top) and ν⊥ (bottom) along x = 3.81 Mm. The red and white lines are as in Figure 2. From the origin, a straight diagonal line represents the trajectory of an object travelling with the initial sound speed c0 = 8.49 km/s and a curved black line indicates the position of an object travelling vertically with the Alfvén velocity. The dashed and dash-dotted lines indicate the trajectory of an object travelling with the negative initial sound speed.
Current usage metrics show cumulative count of Article Views (full-text article views including HTML views, PDF and ePub downloads, according to the available data) and Abstracts Views on Vision4Press platform.
Data correspond to usage on the plateform after 2015. The current usage metrics is available 48-96 hours after online publication and is updated daily on week days.
Initial download of the metrics may take a while.