Fig. A.1.
Download original image
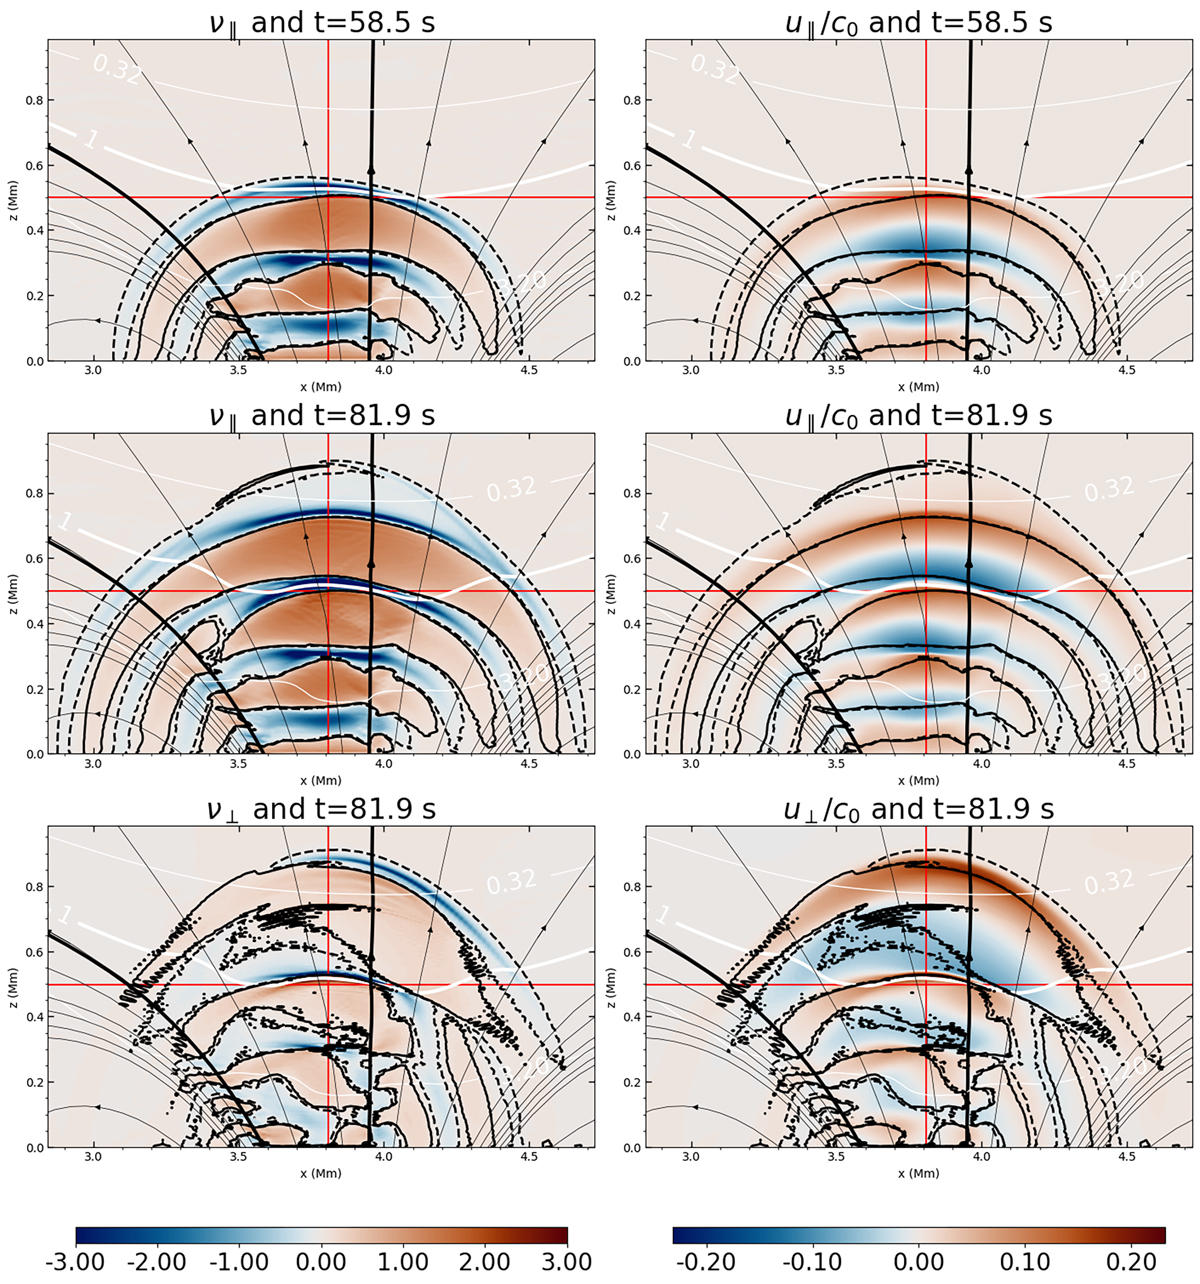
Comparison of the WMI (left) and velocity (right) components at two different times for the weak field with radial driving simulation. The top panels show the parallel components ν∥ (top left) and u∥/c0 (top right) at t = 58.5 s. The middle panels show the parallel components ν∥ (middle left) and u∥/c0 (middle right) at t = 81.9 s. The bottom panels show the perpendicular components ν⊥ (bottom left) and u⊥/c0 (bottom right) also at t = 81/.9 s. For each row, lines of the respective ν* = ±0.05 are overplotted to make comparison between the figures easier. Red, black (non-contour) and white lines are as in Figure 2.
Current usage metrics show cumulative count of Article Views (full-text article views including HTML views, PDF and ePub downloads, according to the available data) and Abstracts Views on Vision4Press platform.
Data correspond to usage on the plateform after 2015. The current usage metrics is available 48-96 hours after online publication and is updated daily on week days.
Initial download of the metrics may take a while.