Open Access
Fig. 2
Download original image
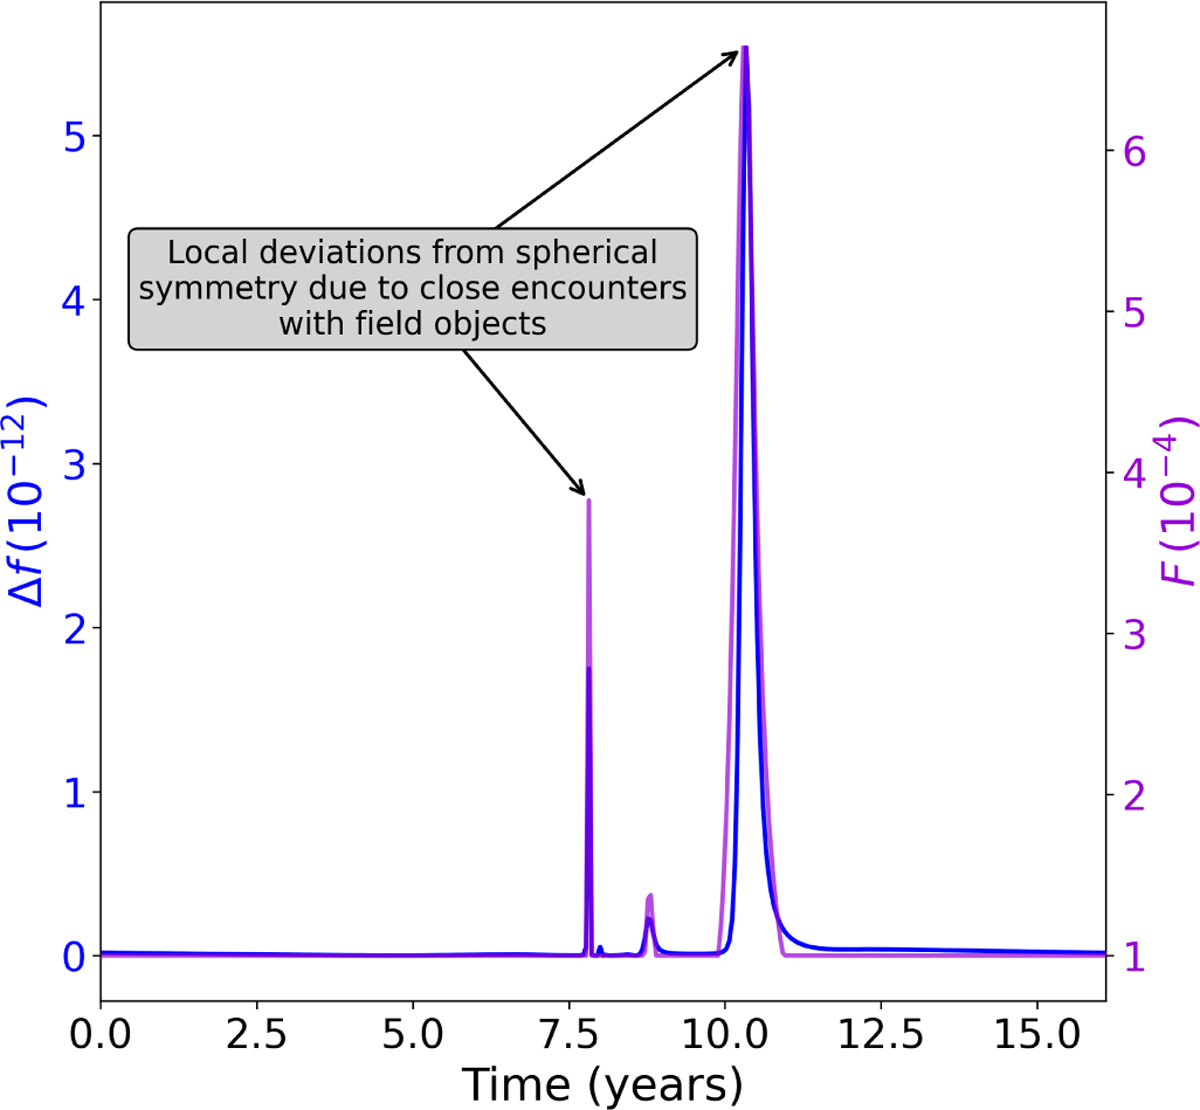
Deviation from spherical symmetry as a function of time, quantified by ∆f (see Section 2.2) and shown in blue for one arbitrarily chosen simulation of the S2 orbit in presence of a cluster of 200 objects of 10 M⊙ each. The force ratio, F, is shown in purple (see Section 2.2).
Current usage metrics show cumulative count of Article Views (full-text article views including HTML views, PDF and ePub downloads, according to the available data) and Abstracts Views on Vision4Press platform.
Data correspond to usage on the plateform after 2015. The current usage metrics is available 48-96 hours after online publication and is updated daily on week days.
Initial download of the metrics may take a while.