| Issue |
A&A
Volume 701, September 2025
|
|
|---|---|---|
| Article Number | A89 | |
| Number of page(s) | 11 | |
| Section | Galactic structure, stellar clusters and populations | |
| DOI | https://doi.org/10.1051/0004-6361/202554223 | |
| Published online | 04 September 2025 | |
Impact of a granular mass distribution on the orbit of S2 in the Galactic center
1
Max Planck Institute for Extraterrestrial Physics, Giessenbachstraße 1, 85748 Garching, Germany
2
Department of Physics, Sapienza, Università di Roma, P.le A. Moro 5, 00185 Rome, Italy
3
Technion – Israel Institute of Technology Haifa, 3200003 Haifa, Israel
4
Astronomy Dept and Oden Institute, University of Texas at Austin, Austin, TX 78712, USA
5
Department of Physics, Technical University of Munich, 85748 Garching, Germany
6
Departments of Physics & Astronomy, Le Conte Hall, University of California, Berkeley, CA 94720, USA
7
Max-Planck-Institute für Radioastronomie, Auf dem Hügel 69, 53121 Bonn, Germany
8
Centro Ricerche Enrico Fermi, Via Panisperna 89a, 00184 Rome, Italy
9
Istituto Nazionale Fisica Nucleare, Unitá Roma 1, Dipartimento di Fisica, Sapienza, Università di Roma, P.le A. Moro 5, 00185 Rome, Italy
10
Istituto Nazionale di Astrofisica, Osservatorio astronomico di Roma, Monteporzio, Italy
★ Corresponding author: This email address is being protected from spambots. You need JavaScript enabled to view it.
Received:
21
February
2025
Accepted:
6
July
2025
Abstract
The orbit of the S2 star around Sagittarius A* provides a unique opportunity to test general relativity and study dynamical processes near a supermassive black hole. Observations have shown that the orbit of S2 is consistent with a Schwarzschild orbit at a 10σ confidence level. The amount of extended mass within its orbit has been constrained to below 1200 M⊙, under the assumption of a smooth, spherically symmetric mass distribution. In this work we investigate the effects on the S2 orbit of granularity in the mass distribution, assuming it consists of a cluster of equal-mass objects surrounding Sagittarius A*. Using a fast dynamical approach validated by full N-body simulations, we performed a large set of simulations of the motion of S2 with different realizations of the cluster objects distribution. We found that granularity can induce significant deviations from the orbit in case of a smooth potential, causing a precession of the orbital plane and variations in the in-plane precession. Larger deviations were observed for higher masses of individual cluster objects and an increased total mass of the cluster. For a cluster mass of 1000 M⊙ enclosed within the apocenter of S2, the average precession of the S2 orbital plane over a full orbit reaches up to 0.2 arcmin for 1 M⊙ cluster objects and up to 1.5 arcmin for 100 M⊙ objects. The in-plane precession deviates by up to 1.5 arcmin, corresponding to a fractional variation of 13%. Interactions with the cluster objects also induce a sort of Brownian motion of Sagittarius A*, with a mean displacement of up to 6 µas and velocity up to 238 m s-1. Our mock data analysis revealed that these effects could produce observable deviations in the trajectory of S2 from a Schwarzschild orbit, especially near the apocenter. During the next apocenter passage of S2 in 2026, astrometric residuals in declination could exceed the astrometric accuracy threshold of GRAVITY (≈30 μas), as typically occurs in 35 to 60% of simulations for black holes of 20-100 M⊙. This presents a unique opportunity to detect, for the first time, scattering effects on the orbit of S2 caused by stellar-mass black holes, thanks to the remarkable precision achievable with GRAVITY and its future upgraded version, GRAVITY+. We also demonstrate that any attempt to constrain the extended mass enclosed within the orbit of S2 must explicitly account for granularity in the stellar-mass black hole population.
Key words: black hole physics / methods: numerical / stars: kinematics and dynamics / Galaxy: center / Galaxy: kinematics and dynamics
© The Authors 2025
 Open Access article, published by EDP Sciences, under the terms of the Creative Commons Attribution License (https://creativecommons.org/licenses/by/4.0), which permits unrestricted use, distribution, and reproduction in any medium, provided the original work is properly cited.
This article is published in open access under the Subscribe to Open model.
Open Access funding provided by Max Planck Society.
1 Introduction
The S-stars orbiting the supermassive black hole (SMBH) Sagittarius A* (Sgr A*) in the Galactic center (GC) offer a unique laboratory for studying the dynamics of stars in an intermediatestrong gravitational field. Among such stars, S2 has played a central role due to its relatively short orbital period of about 16 years and its particular brightness (mκ ≈ 14). Over the past three decades, its motion around Sgr A* has been monitored through adaptive optics-assisted astrometry and spectroscopy at the Very Large Telescope (VLT) and the Keck Observatory (Schödel et al. 2002; Ghez et al. 2003, 2008; Gillessen et al. 2017). Since 2016, the GRAVITY instrument at the Very Large Telescope Interferometer (VLTI), which coherently combines the four 8-meter class telescopes of the observatory, has provided astrometric measurements with unprecedented precision. It achieves a level of accuracy as fine as 30 µas, which is more than 15 times better than what is possible with a single 8-meter telescope (GRAVITY Collaboration 2017).
This progress has enabled highly accurate measurements of the SMBH mass, m• = 4.3 × 10⁶ M⊙, with a precision of 0.3%, and its distance from us, R0 = 8.3 kpc, with a precision of 0.1%. Observations of the pericenter passage of S2 in 2018, when the star reached a distance of 1400 Schwarzschild radii (Rs) from Sgr A* with a speed of about 7700 km s-1 ≃ 0.03 c, enabled the first direct tests of general relativity (GR) in the vicinity of an SMBH (GRAVITY Collaboration 2018, 2020). In particular, the first-order effects in the post-Newtonian (PN) expansion of GR on its orbital motion were detected, which are the gravitational redshift of spectral lines and the prograde in-plane precession of the orbit of δϕ = 3πRS/[a(1 - e2)] ≈ 12 arcmin per orbit, where a and e are the semi-major axis and eccentricity.
To rigorously test whether the orbit of S2 follows a Schwarzschild orbit as predicted by GR at 1PN order, in GRAVITY Collaboration (2020, 2022, 2024) the acceleration of the star is modeled using a 1PN approximation for a massless test particle (Will 1993). The 1PN terms are multiplied by a factor fS P, such that fS P = 0 represents a Newtonian orbit and fS P = 1 represents a Schwarzschild, GR, orbit. Using data up to September of 2022, GRAVITY Collaboration (2024) found fS P = 1.135 ± 0.110, indicating that a Schwarzschild orbit is strongly favored over a Newtonian orbit at a 10σ confidence level. In addition, in GRAVITY Collaboration (2024) constraints are given on the amount of the extended mass that could be distributed around Sgr A* that (if it was spherically symmetric around the massive object) would induce a retrograde precession of the S2 orbit. The mentioned analysis sets an upper limit of ≈1200 M⊙ to the extended mass contained within the orbit of S2, namely within the central ≈0.01 pc of the Galaxy. This value aligns with the predictions from numerical simulations by Zhang & Amaro-Seoane (2024) for a dynamically relaxed stellar cusp surrounding Sgr A*, composed of old stars and stellar remnants, including stellar-mass black holes.
The existence of such a stellar cusp around SMBHs in galactic centers is a long-standing prediction of stellar dynamics. Over a timescale on the order of the two-body relaxation time, a stellar population that is well within the SMBH’s radius of influence would be expected to settle into an equilibrium distribution. To a good approximation, the resulting density profile follows a power law, as first shown by Peebles (1972) and later by Frank & Rees (1976) and Bahcall & Wolf (1976). For a multi-mass stellar population, Bahcall & Wolf (1977) provided a heuristic solution based on the (unphysical) assumption that the mass was equally divided between light stars and heavier stellar-mass black holes. A more physical, self-consistent, solution for a general stellar population was later derived by Alexander & Hopman (2009) and Preto & Amaro-Seoane (2010), who showed how mass segregation drives heavier objects such as stellar-mass black holes into steeper cusps, thus dominating the mass distribution in the innermost regions, namely, within S2’s apocenter of ~0.01 pc for the case of the GC. These compact objects are potential sources of extreme-mass-ratio inspirals (EMRIs), which are likely to be observed by the future LISA mission (Amaro-Seoane et al. 2017; Amaro-Seoane 2018). Numerical simulations, including those by Freitag et al. (2006), Alexander & Hopman (2009) and more recently by Zhang & Amaro-Seoane (2024) suggest that up to 100 stellar-mass black holes could reside within the apocenter of S2 in the GC. This population corresponds indeed to a granular rather than smooth mass distribution, potentially perturbing the orbit of S2. The possibility that an intermediate-mass black hole (IMBH) companion to Sgr A* resides within the orbit of S2 has also been explored, showing that it can only have a mass of <1000 M⊙ to be compatible with observations (GRAVITY Collaboration 2023; Will et al. 2023).
Merritt et al. (2010) and Sabha et al. (2012) first investigated the impact of perturbations caused by a cluster of stellar-mass black holes on stellar orbits near Sgr A*. Merritt et al. (2010) found that such perturbations could introduce a precession of the orbital plane that is comparable in magnitude to that caused by the Lense-Thirring effect, potentially complicating the detection of the spin and quadrupole moment of Sgr A*. They concluded that detecting the spin of Sgr A* would require observation of stars with semi-major axes ≲1 mpc, where relativistic effects would dominate over perturbations. Zhang & Iorio (2017) later confirmed this result, analyzing the impact of these perturbations on the orbital motion and redshift of the stars. However, they pointed out that in principle, the dynamical signatures of stellar perturbations might be distinguishable from GR spin effects, suggesting that the conclusions of Merritt et al. (2010) could be somewhat pessimistic.
In this work, we conducted an extensive statistical study to assess the impact of the granularity of the mass distribution in the GC on the orbit of the S2 star, as compared to a smooth, spherically symmetric distribution. Since the spin of Sgr A* produces negligible (at the level of present observational facilities) effects on the motion of S2, we considered it sufficient to model Sgr A* as a Schwarzschild SMBH. Specifically, we simulated the orbit of S2 around a Schwarzschild SMBH representing Sgr A* surrounded by a star cluster composed of equal-mass objects. To study the effects of this granular mass distribution, in Section 2, we report a set of results from a large set of numerical simulations performed using a fast, simplified dynamical approach, varying both the total mass of the cluster and the mass of individual cluster components. In Section 3, we compare a subset of these results to those obtained using some full N-body simulations. Given the remarkable precision now achievable with GRAVITY, in Section 4, we present a mock data analysis to investigate whether the granularity of the mass distribution could cause observable deviations in the motion of S2 with respect to its best-fit Schwarzschild orbit. Finally, in Section 5, we draw our conclusions and discuss the implications of our findings for future observations.
2 Simplified dynamical approach
2.1 Method
The aim of this work is to study the relevance of the granularity of the gravitational field acting on the S2 star orbiting Sgr A*. To this end, we simulated a test star (S2) orbiting an SMBH of mass m• (Sgr A*), using our own quadruple-precision Fortran 90 integrator. This is a one-body code which integrates the equations of motion of the test star by means of a fourth-order Runge-Kutta method with variable time stepping. The star starts its motion from the apocenter in the x-y plane, with the initial conditions expressed as
 (1)
(1)
At zeroth order (Newtonian case) the apocenter distance is ra,S2 = a(1 + e) and the speed at apocenter is  , where a and e are the semimajor axis and eccentricity, respectively, of the unperturbed Newtonian orbit.
We assumed that a number N of point-mass particles of equal mass, m, are distributed around the central SMBH. We sampled their positions from a power-law density distribution of ρ(r) = ρ0(r/r0)α, with α < 0, which is approximately the steadystate density distribution of a cluster of stars and stellar remnants around an SMBH. We note that the two-body relaxation time evaluated at r = ra,S2 ≈ 0.01 pc for a stellar cusp of identicalmass objects is (following Amaro-Seoane 2018, Eq. (15)) trlx ≳ 5 × 10⁷ yr for m ≤ 100 M⊙. This result significantly exceeds the 16 yr orbital period of S2. Consequently, the radial density profile does not change appreciably over a single S2 orbit.
We sampled the positions of the N objects up to a cut radius of rcut > ra,S2. We chose α = -2 and rcut = 2ra,S2 following our verification that the results depend weakly on the choice of α and rcut, provided the enclosed mass within the apocenter of S2 is kept constant and α is within reasonable limits predicted for a stellar cusp (see, e.g., Bahcall & Wolf 1977; Alexander & Hopman 2009). The position sampling was done by inverting the cumulative mass distribution, defined as M(< r)/Mt, where Mt = Nm is the total cluster mass. We assumed that each body is fixed in space, with a position of rj(t) = rj0 and velocity of vj(t) = 0, ∀ t and j = 1,.., N.
For a reference frame centered on the SMBH, the equation of motion for the test star is
 (2)
(2)
where G is the gravitational constant and f1PN is the first-order PN force per unit mass acting on the test star due to the presence of the SMBH (Mora & Will 2004). Here, we neglected the higher order PN terms, such as those accounting for the spin of a Kerr rotating SMBH, as they have a negligible contribution to the orbital motion of S2 (Capuzzo-Dolcetta & Sadun-Bordoni 2023).
We thus modeled the orbit of the test star as the solution of a one-body problem, where the star moves under the gravitational influence of the SMBH and the N bodies of the cluster. We neglected mutual interactions among the cluster bodies and with the SMBH, treating them as fixed particles in space that provide a granular contribution to the otherwise smooth gravitational field. This approach is significantly faster than time integration with a full N-body code, as its execution over time scales as O(N) instead of O(N2). This efficiency enables a large statistical study that would be otherwise infeasible with a full N-body approach.
We considered different cluster and particle masses, as illustrated in Figure 1. The enclosed mass within the apocenter of S2, Me,S2, varies from 100 M⊙ to 1500 M⊙, consistent with the upper limit of approximately 1200 M⊙ at the 1σ confidence level reported by GRAVITY Collaboration (2024). The enclosed mass is distributed among cluster particles of equal mass, m, which varies from 1 M⊙ to 100 M⊙ (with the number N of cluster particles changing accordingly). We thus explored cases ranging from a cluster of 1 M⊙ stellar objects to a cluster of stellar mass black holes with masses up to 100 M⊙, motivated by the observed population of merging binary black holes (Abbott et al. 2023).
For each choice of Me,S2 and m, we performed 100 simulations, each corresponding to a different realization of the spatial distribution of the cluster objects, to obtain an adequate statistic. Each simulation was carried out over 1.1 times the radial period of S2.
The values of the semi-major axis and eccentricity of S2, and of the mass of Sgr A*, were taken from Table B.1 of GRAVITY Collaboration (2022). For computational convenience, the units were chosen so that G = 1, the unit of mass is the SMBH mass, m•, and the unit of length is D = 10 mpc, which corresponds roughly to the apocenter distance of S2.
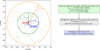 |
Fig. 1 Left: S2 orbit (in blue) around Sgr A* (marked by a red cross) and a particular realization (black dots) of the distribution of the surrounding cluster particles, as described in Section 2.1. The total mass in cluster particles enclosed within the apocenter distance of S2, ra,S2 (in green), is denoted as Me,S2. The particles are sampled up to a distance 2 × ra,S2 (in orange). Right: flowchart describing the analysis procedure. |
2.2 Results
The first thing to note in our numerical simulations is that the granularity of the potential naturally leads to a breaking of spherical symmetry. The departure from spherical symmetry of the force acting on the test star can be quantified by ∆ f = |f · r̂|/f - 1, where f is the total force per unit mass acting on S2 at any given time, f is its magnitude, and r̂ is the radial unit vector. This quantity is zero for a spherically symmetric force field. However, as illustrated in Fig. 2, we find deviations from zero. These deviations, in principle, arise from a combination of global deviations from spherical symmetry, as well as local scattering events between the star and the cluster objects. To investigate the main cause of these deviations, we evaluated the ratio  between the norm of the force due to the interaction of the test star with the cluster objects and that of the force due to Sgr A*, considering only the number Ns < N of encounters giving
  . The overlap between F and ∆f in Fig. 2 clearly indicates that deviations from spherical symmetry in the simulations are due to the strongest encounters occurring between S2 and the cluster objects. Depending on the specific sampling of the positions of the cluster objects, the strength of the scattering interactions varies, with the force ratio fi/fS grA* reaching ~102 for the strongest interactions observed across the simulations performed. This outcome demonstrates the importance of performing a large statistical study in correctly analyzing the effect of the granularity of the mass distribution around the central SMBH on the orbit of S2. To obtain significant results, we need a large set of simulations with different realizations of the sampling of the cluster objects.
The orbit of a test star around a Schwarzschild SMBH is planar and characterized by an in-plane, prograde precession of the pericenter angle. The introduction of a smooth, spherically symmetric mass distribution surrounding the SMBH maintains the planarity of the orbit of the star and adds a retrograde precession. In these cases, both the orbital energy and angular momentum are conserved quantities. Breaking the spherical symmetry of the potential, as in the granular case, implies that the orbit of the star is no longer planar. In our case, the star and its velocity initially lie in the x - y plane, so that the spherical symmetry breaking implies that the star acquires a z displacement and a vz velocity component. While the orbital energy is still conserved, as our system is static, the modulus nor the direction of the angular momentum are no longer conserved. Consequently, in addition to the in-plane orbital precession, a precession of the instantaneous orbital plane occurs. The precession angle, θ, of the orbital plane with respect to the initial x - y plane is calculated as
 (3)
(3)
where L(t) is the orbital angular momentum at time, t.
The in-plane precession can be calculated by considering two consecutive apocenter passages of the test star, such that after a full radial period the angular shift is equal to
 (4)
(4)
This quantity corresponds exactly to an in-plane orbital precession only if the test star, starting its motion in the x - y plane, follows a planar orbit. Since in our simulations the orbit is non-planar, this quantity represents the angular precession of the orbit projected onto the x - y plane, which is the initial orbital plane of the test star.
As described in Section 2.1 and summarized in Figure 1, we varied both the total mass of the cluster of particles enclosed within the apocenter distance of S2, Me,S2, and the mass, m, of the individual particles. For each configuration, we performed 100 simulations of the motion of S2 with different realizations of the positions of the particles, which led to different trajectories. For each simulation, we computed the in-plane precession, δϕxy, and the average precession of the orbital plane over a full radial period, ⟨θ⟩, as expressed in Eqs. (3) and (4). We chose 100 sampling realizations as a practical compromise. A larger ensemble would give a more reliable statistical study, however, we checked that the results on δϕxy and ⟨θ⟩ obtained with our sampling choices present statistical uncertainties subdominant to physical ones1. This ensures reliable statistics without excessive computational cost.
We find that the trajectory of S2 indeed deviates from a planar orbit, with the deviation depending on the specific sampling of the positions of the cluster particles. Across the simulations conducted, we observe that the orbital plane of S2 can precess by up to a significant fraction of the in-plane Schwarzschild precession (12 arcmin per orbit). To better visualize and quantify the impact of the granularity of the mass distribution on the orbit of S2, in Figure 3, we present violin plots (Hintze & Nelson 1998) illustrating the distribution of δϕxy and ⟨θ⟩ for two representative cases, corresponding to Me,S2 = 100 M⊙ and Me,S2 = 1000 M⊙, as a function of the mass of the cluster particles. Violin plots are useful in this case as they show the median, spread, and shape of the δϕxy and ⟨θ⟩ distributions.
For Me,S2 = 100 M⊙, the median in-plane precession is close to the value predicted for a 1PN Schwarzschild orbit (the retrograde precession caused by a smooth distribution with Me,S2 = 100 M⊙ is negligible), with little spread in the distribution. The average orbital plane precession is similarly small, remaining below 0.2 arcmin. This is expected in a regime where the number of cluster particles is very low (100 particles of 1 M⊙ or one particle of 100 M⊙ ), reducing the probability of scattering events to occur. Thus, the deviations from a Schwarzschild orbit are not very pronounced.
When increasing Me,S2, deviations from a smooth potential become more noticeable. The median in-plane precession remains consistent with the value predicted in a smooth potential, but the distribution broadens significantly with increasing mass (and correspondingly with decreasing number) of the cluster objects, reflecting the more pronounced granularity of the gravitational potential. This can be explained by the fact that more massive cluster objects act as stronger perturbers, as illustrated in Fig. 4, inducing more significant trajectory deviations with respect to an orbit in a smooth potential. For Me,S2 = 1000 M⊙, the width of the in-plane precession distribution (5th-95th percentile) increases from ≈0.2 arcmin for m = 1 M⊙ to ≈2 arcmin for m = 100 M⊙ (see Figure 3). We find a deviation with respect to the value expected in a smooth potential up to ≈1.5 arcmin, corresponding to a fractional variation of ≈13%. The average orbital plane precession also grows with increasing m (decreasing N), with a median value of ≈0.1 arcmin for m = 1 M⊙ and ≈0.5 arcmin for m = 100 M⊙. The distribution also becomes broader with increasing m, reaching up to ≈1.2 arcmin (90th percentile), namely, ≈10% of the Schwarzschild in-plane precession.
A further increase in Me,S2 causes a broader in-plane precession distribution for each value of m and leads to an even broader median and range in the orbital plane precession distribution. In Table 1, we give the median and range of both distributions for each value of Me,S2 and m considered. Overall, we find that deviations from a smooth potential are larger in scenarios where the cluster is divided into more massive (and fewer) particles, in line with intuitive expectations, as the granular fluctuations over the mean field become more pronounced and the interactions between S2 and the cluster objects are stronger on average. In addition, such deviations become more pronounced with increasing total enclosed mass, Me,S2, as the number of scattering events increases due to the larger number of cluster particles. These results indicate that the granularity of the mass distribution plays a significant role in shaping the S2 orbital properties, so that approximating the actual mass distribution in this region with a smooth potential could be highly inaccurate.
In conclusion, due to mass segregation, we expect that the mass distribution within the S2 orbit (in the central 0.01 parsec) is dominated by stellar-mass black holes (GRAVITY Collaboration 2024). Approximating the mass distribution in this region with a population of light stars with masses of 1 M⊙ and heavier stellar black holes with masses of 10 M⊙, GRAVITY Collaboration (2024) predicts that around 1200 M⊙ of extended mass lies within the apocenter of S2, of which 2/3 (800 M⊙) is in stellar black holes and 1/3 (400 M⊙) is in stars. We performed 100 simulations in this scenario and confirmed that the stellar black holes dominate the scattering, acting as the main contributors to deviations of the actual S2 orbit from the one in a smooth potential. In this scenario, they cause an average orbital plane precession of up to ≈0.5 arcmin and a fractional variation in the in-plane precession of up to ≈4.5%. Perturbations from the stars are negligible in this case.
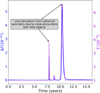 |
Fig. 2 Deviation from spherical symmetry as a function of time, quantified by ∆f (see Section 2.2) and shown in blue for one arbitrarily chosen simulation of the S2 orbit in presence of a cluster of 200 objects of 10 M⊙ each. The force ratio, F, is shown in purple (see Section 2.2). |
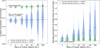 |
Fig. 3 Violin plots showing the in-plane angular precession (left panel) and the average orbital plane precession (right panel) as a function of the mass of the cluster objects, for Me,S2 = 100M⊙ (green) and Me,S2 = 1000M⊙ (blue). The dots show the median value of the distributions, the vertical segments indicate the breadth of the distributions, going from the 5th to the 95th percentile in case of the in-plane precession and from the minimum value to the 90th percentile in case of the orbital plane precession. |
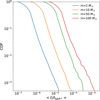 |
Fig. 4 Cumulative distribution functions (CDFs) of the average (over a radial period) of the ratio fi/fS grA*, between the norm of the force exerted on S2 by each cluster object and that due to Sgr A*. Here, Me,S2 is set to 1500 M⊙ and m is varied as indicated in the figure. Larger values of m lead to stronger interactions on average between S2 and the cluster particles. |
Median values of δϕxy and ⟨θ⟩ (in arcminutes) obtained for different choices of Me,S2 and m.
3 Comparison with a full N-body approach
To validate our simplified dynamical approach, we simulated a subset of the above cases with full N-body simulations, using the ARWV code (Mikkola & Tanikawa 1999b,a; Chassonnery et al. 2019; Chassonnery & Capuzzo-Dolcetta 2021). This is a chain-regularized code that includes post-Newtonian corrections up to an order of 2.5 PN in the potential exerted by the SMBH on the test star S2. We neglected post-Newtonian cross-terms (coupling the central SMBH, S2, and the cluster objects), which would arise at the order of 1PN (Will 2014; Amaro Seoane et al. 2025) because over a single 16 yr revolution of S2, Newtonian perturbations from the cluster objects dominate over any PN coupling effects. We adopted the same code units as those mentioned in Section 2.1.
A key advantage of our simplified approach is its low computational cost. For instance, simulating a single realization of a system with 128 cluster objects of 20 M⊙ takes approximately 349 seconds with ARWV on a laptop2. The same simulation using our simplified method requires only 3 seconds on the same machine – a speedup that is nearly 120 times faster. For 100 simulations, this results in a total runtime of about 10 hours with ARWV , compared to just 5 minutes with our simplified method. Additionally, while the computational complexity of ARWV scales as O(N2), our approach scales as O(N), making the difference in execution time even more pronounced as the number of cluster objects increases. Furthermore, ARWV imposes practical limitations on the maximum number of particles that can be simulated. These factors justify our choice to use our simplified approach for the large statistical study in Section 2, where we explore a broad range of total cluster masses and individual object masses.
Here, due to the high computational cost associated with N -body simulations, we focus on three cases corresponding to cluster objects with masses of 20, 50, and 100 M⊙; as a result, the enclosed mass within the apocenter of S2 is Me,S2 = 1000 M⊙, on average. For each case, we performed 100 simulations with different samplings of the initial positions and velocities of the cluster objects, as we describe here.
We assumed a spherical symmetry and randomly sampled the initial orbital elements of the bodies, assuming a uniform semi-major axis distribution, thermal eccentricity distribution, and isotropic angular coordinates. The semi-major axes are sampled from 0 to 10 ra,S2 and particles not passing within 2 ra,S2 during the integration time (1.1 radial periods of S2) were excluded. This process ensures that approximately  particles are within the apocenter of S2 at any given time, with some variation as the cluster particles move along their orbits.
To ensure consistency among the two methods under comparison, we used the same initial spatial distribution of the cluster objects, rj(t = 0), in both the simplified and full N-body simulations. This avoids discrepancies arising from differences in the sampling procedure of the two approaches. Importantly, in the full N -body simulations the cluster objects are given nonzero initial velocities uj(t = 0), while in the simplified approach, the bodies are assumed to be fixed in space.
To illustrate the difference between the motion of S2 in a fixed potential versus a fully dynamical N-body system, we begin with a simple analytical calculation. Under the impulse approximation, a close passage at impact parameter b with relative speed, vrel, imparts a transverse kick,
 (5)
(5)
For a fixed perturber, vrel = v, where v is the speed of S2, giving ∆vfixed = 2Gm/(bv).
In a full N-body system, the perturber’s own velocity, vp, leads to
 (6)
(6)
where α is the angle between the two velocity vectors, so ∆vN-body = ∆vfixed (v∕vrel). Depending on the encounter geometry, α, the kick can be either amplified or suppressed. Statistically, allowing the perturbers to move broadens and skews the distributions of changes in velocity, ∆v, and thus in the orbital energy and angular momentum (or semi-major axis and eccentricity of the orbit).
We move on to the computation of the same quantities analyzed in Section 2.2, namely, the in-plane orbital precession and the average orbital plane precession over a full radial period. In the case of full N-body simulations (performed in the center of mass frame), we considered the motion of S2 with respect to the central SMBH. A change in the in-plane precession relative to the smooth-potential value and a precession of the orbital plane both arise from the cumulative effect of many individual kicks over the course of the orbit. Figure 5 compares the results for the two different methods. The in-plane precession distributions are consistent between the two methods, both in median value and spread, with the median matching the precession expected in case of a smooth potential of the same enclosed mass. However, the orbital plane precession distribution differs: we find a shift toward higher median values in the full N-body simulations compared to the simplified approach. This discrepancy can be explained by the Brownian motion of the central SMBH, which is accounted for in the N -body simulations, but neglected in the simplified approach. In fact, we confirmed this by using the IAS15 integrator in REBOUND (Rein & Liu 2012; Rein & Spiegel 2015) and REBOUNDX (Tamayo et al. 2020), which allows us to study the motion of S2 and the cluster bodies relative to a fixed SMBH (i.e. the SMBH is replaced by a fixed potential). We find that in this case, the median values of the orbital-plane precession distribution are similar to those obtained with the simplified approach. However, the general conclusion drawn from the analysis done in Section 2 is also valid for the full N-body simulations; namely, deviations from a smooth potential are larger with more massive (and fewer) cluster particles.
For completeness, we summarize the mean and standard deviation of the SMBH displacement from its initial position, ⟨∆rSgrA∗⟩, and its velocity, ⟨vS grA∗⟩, in the N-body simulations for different masses of the cluster objects in Table 2.
These values are consistent with the constraints on the motion of Sgr A* from radio observations (Reid & Brunthaler 2020), giving an apparent motion of -0.58 ± 2.23 km s-1 in the direction of Galactic rotation and -0.85 ± 0.75 km s-1 toward the North Galactic Pole. In addition, we verified that the mean square velocity of the SMBH  is directly proportional to the mass m of the cluster objects, as expected from energy equipartition between the SMBH and the cluster (Merritt et al. 2007).
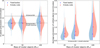 |
Fig. 5 Violin plots comparing the results obtained with the simplified approach (in blue) and the full N-body code (in red). The plots display the in-plane precession (left panel) and the average precession of the orbital plane (right panel) of S2 over one radial period, as a function of the mass of the cluster objects. The dots show the median value of the distributions, while the vertical segments indicate the breadth of the distributions, going from the 5th to the 95th percentile for the in-plane precession and from the minimum value to the 90th percentile for the orbital plane precession. |
Motion of Sgr A* in the N-body simulations for different cluster object masses.
4 Orbit fitting: deviations from a Schwarzschild orbit
The orbit of S2 around Sgr A* is in remarkable agreement with the predictions of GR, exhibiting a Schwarzschild, inplane orbital precession of approximately 12 arcmin per orbit. In GRAVITY Collaboration (2020, 2022, 2024), an orbital fit was performed to test the compatibility of the astrometric and spectroscopic data obtained for S2 with a Schwarzschild orbit around Sgr A*, introducing the parameter fS P (see Section 1). The result reported by GRAVITY Collaboration (2024) is fS P = 1.135 ± 0.110, where fS P = 0 corresponds to a Keplerian orbit and fS P = 1 to a Schwarzschild GR orbit. This indicates that the orbit is compatible with a Schwarzschild orbit at a ≈10σ confidence level. In addition, an orbital fit was also done assuming fS P = 1 and a smooth and spherically symmetric extended mass profile, finding an upper limit Me,S2 < 1200 M⊙ for the total extended mass enclosed within S2’s orbit (GRAVITY Collaboration 2024).
Our goal in this section is to assess whether perturbations caused by a cluster of stellar-mass black holes around Sgr A* could significantly impact the observed orbit of S2, particularly in terms of the measurement of fSP and Me,S2. To do so, we performed a mock data analysis using the results of the simulations from Section 3, considering the orbit of S2 around Sgr A* in the presence of a cluster of N black holes of equal mass m. We considered a population of black holes of 20, 50, and 100 M⊙, ensuring that the total enclosed mass within the apocenter of S2 is always Me,S2 = 1000 M⊙, consistent with the most recent observational constraints (GRAVITY Collaboration 2024).
For each assumed mass of the stellar-mass black holes and each performed simulation, we converted the data into mock observational data. From each simulation, we extracted the position r(t) and velocity υ(t) of S2 with respect to Sgr A* in Cartesian coordinates at each time step. For the analysis, we sampled approximately ten data points per year over a full orbital period of S2, starting from the apocenter. The simulated orbit is then projected onto the observer’s plane, using the orbital parameters in GRAVITY Collaboration (2022). The resulting mock data set consists of the on-sky position of S2, given by its right ascension (RA) and declination (Dec) in arcseconds, and its radial velocity in km s-1 as functions of time, mimicking the observational data. The star starts its motion at apocenter at tapo = 2010.35, which is consistent with observations.
These data were subsequently used for orbital fitting, where we fit for the six orbital parameters describing the initial osculating Kepler orbit, along with the mass and distance of the central SMBH. Additionally, to test the compatibility with GR, we include the parameter fSP. The fitting was performed with a Levenberg-Marquardt χ2 minimization algorithm, using the same code used for fitting the observational data of S-stars. More details are reported in GRAVITY Collaboration (2018, 2019, 2020).
Figure 6 (left) displays the results on the distribution of fSP, obtained from 100 simulations conducted for each value of the mass of the cluster bodies. We compared again the distributions obtained from the simplified dynamical approach and the full N -body code. We observe that the median fSP value is smaller than 1, consistent with the value expected for a GR orbit with a smooth mass distribution of Me,S2 = 1000 M⊙. However, the range of the fSP distribution is significant, comparable to or exceeding the observational uncertainty of ≈0.1. For instance, in the case of a distribution of black holes of 20 M⊙, the fSP distribution obtained through N -body simulations spans approximately 0.87–1.04 (5th–95th percentile). With fewer but more massive cluster objects, the distribution broadens further, ranging approximately between 0.78 and 1.07 in the case of black holes of 100 M⊙. While the distributions obtained from the simplified dynamical approach are slightly narrower than those from N-body simulations, the general conclusions remain unchanged. This analysis shows that perturbations from a population of stellar-mass black holes can cause measurable deviations from a Schwarzschild orbit. Accounting for these effects is crucial, particularly given the high precision achievable with the GRAVITY instrument.
In Table 3, we present the fitting results for the specific case of black holes of m = 20 M⊙, not only for fS P, but also the mass of Sgr A* (m•), its distance (R0), and the six orbital parameters of S2: semi-major axis (a), eccentricity (e), inclination (i), argument of pericenter (ω), longitude of ascending node (Ω), and time of pericenter passage (tp ). Our findings show that the mass of Sgr A* can vary by up to approximately 0.13% from its average value, a variation that is comparable to the observational uncertainty on this parameter. Similar conclusions can be drawn for the distance and the orbital elements of S2. This suggests that the granularity of the mass distribution must be taken into account to correctly estimate these parameters.
We also fit the mock data under the assumption of fSP = 1 and a smooth power-law density distribution,
 (7)
(7)
as it is the very profile used to sample the granular potential, estimating the enclosed mass, Me,S2. The goal is to quantify how a smooth-potential fit can misestimate Me,S2 with respect to the "true" value of Me,S2 ≈ 1000 M⊙, when the distribution is granular. Figure 6 (right panel) shows the distribution of the recovered Me,S2 for both our simplified dynamical model and the full N-body simulations. As with fSP, the distributions obtained from full N-body simulations are broader. For cluster objects of 20 M⊙, the 5th-95th percentile range spans ~500 to 3800 M⊙. For 100 M⊙ objects, it expands further, from approximately -1000 to 6000 M⊙. Thus, granularity in itself can bias the inferred enclosed mass by up to a factor of ~6. Moreover, for 50-100 M⊙ cluster objects, a non-negligible fraction of realizations give negative Me,S2 values: in these cases, stochastic close encounters produce a net prograde precession that overwhelms the retrograde precession expected from a smooth mass distribution. These results demonstrate that fitting the orbit of S2 with a smooth extended potential, when the true background is granular, can lead to wrong or even unphysical mass estimates. Therefore, future attempts to constrain the extended mass within the orbit of S2 must account for granularity in the stellar-mass black hole population.
In addition, we also analyzed the residuals in astrometry and radial velocity between each simulated orbit and the respective best-fit Schwarzschild orbit (with fSP fixed to 1). In Fig. 7, we plot the residuals in Dec, RA, and radial velocity as a function of time for the 100 full N-body simulations conducted, for each of the three different black hole masses considered. In each plot, we highlight the median, the 68th percentile, and 90th percentile of the distribution. We stress that to isolate the true observational signature of the perturbations by a cluster of stellar-mass black holes, it is essential to fit each mock data set with a relativistic orbit and then examine the residuals. Simply taking the instantaneous difference between a perturbed trajectory and the unperturbed one would introduce artificial peaks at pericenter: because perturbations slightly change the orbital period, the two trajectories dephase and produce large spatial offsets where the orbital velocity is highest. By contrast, real observations do not sample an instantaneous offset between two fixed trajectories, but rather measure a single set of astrometric and spectroscopic data that must be fitted to a model orbit. By fitting the mock data, any phase drift is absorbed and the residuals accurately reflect where perturbations are actually measurable.
We find that the astrometric residuals are strongly timedependent, with the largest astrometric deviations occurring almost always near apocenter. This can be naturally explained by the fact that the star spends more time in the apocenter half of its orbit, where the gravitational force exerted by the SMBH is weaker, allowing perturbations to play a more significant role. Indeed, for 20 M⊙ perturbers the average force ratio ⟨fgrαn/fMBH⟩ at apocenter is ~15 times larger than at pericenter. In addition, at apocenter the star is at larger separation from Sgr A* and, as a result, the deviations are magnified.
In the apocenter half of the orbit, the residuals are significantly larger in Dec than in RA. This can be explained by the geometry of the orbit of S2, as the star explores a broader range in Dec. Looking at the astrometric residuals in 2022.7, which is the time corresponding to the most recent data of S2 analyzed in GRAVITY Collaboration (2024), we notice that they are relatively small, with a 68% probability of being smaller than 30 µas, which is around the astrometric accuracy of GRAVITY. This may explain why the orbit of S2 in GRAVITY Collaboration (2024) is in perfect agreement with a Schwarzschild orbit, as it is very likely that deviations caused by the granular mass distribution are below the accuracy of GRAVITY. However, looking at the residuals at the time of the next apocenter passage of S2 in 2026.35, the residuals in Dec can be significantly larger than the astrometric accuracy of GRAVITY. They are larger than 30 µas in 35% (for black holes of 20 M⊙) to 60% (for 100 M⊙) of the simulations. In around 10% (for 20 M⊙) to 25% (for 100 M⊙) of the simulations performed the residuals are even larger than 100 µas. These results offer hope for detecting a deviation of the S2 orbit from a pure Schwarzschild orbit predicted by GR with future astrometric observations. In fact, observing a residual in Dec around the time of the next apocenter passage of S2 in 2026.35, the first to be observed with GRAVITY, could provide direct evidence of scattering effects on the orbit of S2 induced by a population of stellar-mass black holes. In fact, by 2026 the upgrade of GRAVITY to GRAVITY+ at the VLTI (GRAVITY+ Collaboration 2022) will be completed, potentially reaching an even higher astrometric accuracy.
Finally, the residuals in radial velocity are largest at pericenter. However, in almost all cases they are below the precision of current instrumentation, such as the ERIS spectrograph at the VLT, which achieves an accuracy of approximately 7 km s-1 for S2.
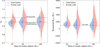 |
Fig. 6 Violin plots of the best-fit fsp (left) and Me,S2 (right) obtained through a mock data analysis. Results from the simplified approach are shown in blue, while those from the full N-body simulations are shown in red. |
Statistics of fitted parameters for cluster objects of m = 20 M⊙.
5 Conclusions
In this paper, we analyze the impact of the granularity of the mass distribution, assumed to be a cluster of equal-mass objects, on the orbit of S2 around Sagittarius A*. We used a statistically reliable set of simulations to carry out the analysis, with our main conclusions listed below.
The presence of a granular mass distribution leads to deviations from the motion in cases of a smooth potential, primarily driven by local scattering events, leading to a precession of the orbital osculatory plane and a variation in the in-plane angular precession.
Larger deviations occur when considering larger total mass of the granular distribution, as well as a larger mass of the individual cluster objects. For an enclosed mass of 100 M⊙ within the apocenter of S2, the average precession of the orbital plane reaches up to 0.2 arcmin. For an enclosed mass of 1000 M⊙, it reaches up to 0.2 arcmin for 1 M⊙ cluster objects and up to 1.5 arcmin for 100 M⊙ objects. In the latter case, the in-plane precession can deviate by up to 1.5 arcmin, corresponding to a fractional variation of 13%.
Our results, obtained with a simplified dynamical approach, have been validated, for a subset of cases, with full N -body simulations. While the in-plane precession results obtained in the two ways are fully consistent, the N -body simulations reveal larger orbital plane precession. This is attributed to the Brownian motion of the SMBH, induced by the interaction with the cluster objects, which is absent in the simplified approach. The SMBH experiences a mean displacement up to 6 µas and a mean velocity up to 238 m s-1 over one radial period of S2, in the case of 100 M⊙ cluster objects.
Mock data analysis reveals that perturbations caused by stellar-mass black holes on the orbit of S2 could produce observable deviations from a Schwarzschild orbit. The parameter fSP, which quantifies deviations from a Schwarzschild orbit, can deviate significantly from 1 in the presence of a granular distribution, exceeding the current observational uncertainty of ≈0.1. The astrometric residuals between the simulated orbits and the respective best-fit Schwarzschild orbits are strongly time-dependent. Around apocenter, the residuals in Declination exceed the accuracy of GRAVITY in more than 35–60% of simulations, assuming black holes with masses between 20 and 100 M⊙ . This makes the upcoming apocenter passage of S2 in 2026 a unique opportunity to detect, for the first time, scattering effects on the orbit of S2 caused by stellar-mass black holes. In contrast, the residuals in the radial velocity are largest at the pericenter, but still typically below the precision achievable with the current instrumentation.
Our mock data analysis further revealed that fitting the orbit of S2 under the assumption of fSP = 1 (i.e. Schwarzschild orbit) and a smooth extended mass profile (as done by GRAVITY Collaboration 2024) when the true distribution is granular can result in wrong or even unphysical mass estimates. The inferred enclosed mass within S2’s orbit, Me,S2, can deviate by up to a factor of ∼6 from the true value and may even be negative. Thus, any attempt to constrain the extended mass within the orbit of S2 must explicitly account for granularity in the stellar-mass black hole population.
As a final remark, the detection of perturbations caused by stellar-mass black holes on the orbit of S2 would have profound implications beyond the immediate study of GC dynamics. In fact, such observations would provide direct evidence of the presence of stellar-mass black holes in the GC region, which are predicted to be progenitors of EMRIs (Amaro-Seoane et al. 2017). While the merger rate of EMRIs in the GC is expected to be negligible, a significant population of stellar black holes in their early inspiral phase, known as early EMRIs, could still be detected by LISA. These detections would enable measurements of the mass and spin of Sgr A* with remarkable accuracy (Amaro Seoane et al. 2024; Amaro-Seoane & Zhao 2025; Amaro Seoane et al. 2025). Future observations with GRAVITY and its upgraded version GRAVITY+ (operational in 2026) will probe the hidden population of stellar-mass black holes years before LISA’s launch, helping to determine whether early EMRIs in the GC will be detectable and providing an observational constraint on the EMRI rate in Milky Way–like galaxies. In addition, before the launch of LISA, the MICADO instrument at the ELT (Davies et al. 2018) will enable the observation of much fainter stars than currently possible with GRAVITY, with the potential to identify stars on tighter orbits around Sgr A*. Such stars could provide an opportunity to measure the spin of Sgr A* (Merritt et al. 2010; Waisberg et al. 2018; Capuzzo-Dolcetta & Sadun-Bordoni 2023). However, as noted in Merritt et al. (2010), perturbations by stellar-mass black holes may complicate the detection of the spin. Nonetheless, it is apparent that the Lense-Thirring effect is strongly peaked at the pericenter, offering a hope of disentangling the influence of the spin from the effects of stellar perturbations (Zhang & Iorio 2017).
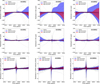 |
Fig. 7 Residuals in Dec (first row), RA (second row), and radial velocity (third row) as functions of time, between the 100 simulated orbits in the granular case (full N-body simulations) and the respective best-fit Schwarzschild orbits (fSP = 1). The first column gives the results considering a population of 20 M⊙ black holes, the second column 50 M⊙ black holes, the third 100 M⊙ black holes. Each of the 100 residual curves is shown in light grey, highlighting their median (solid black line), 68th percentile (red filled area), and 90th percentile (blue filled area). |
Acknowledgements
We thank Pau Amaro-Seoane for the helpful comments that improved this paper. A.G. was supported at the Technion by a Zuckerman Fellowship. This work made use of the following software packages: Astropy (Astropy Collaboration 2013, 2018, 2022), ARWV (Chassonnery et al. 2019), Jupyter (Kluyver et al. 2016), Matplotlib (Hunter 2007), NumPy (Harris et al. 2020), pandas (Wes McKinney 2010), REBOUND (Rein &Liu 2012), SciPy (Virtanen et al. 2020).
References
- Abbott, R., Abbott, T. D., Acernese, F., et al. 2023, Phys. Rev. X, 13, 011048 [NASA ADS] [Google Scholar]
- Alexander, T., & Hopman, C. 2009, ApJ, 697, 1861 [NASA ADS] [CrossRef] [Google Scholar]
- Amaro-Seoane, P. 2018, Liv. Rev. Relativ., 21, 4 [NASA ADS] [CrossRef] [Google Scholar]
- Amaro-Seoane, P., & Zhao, S.-D. 2025, arXiv e-prints [arXiv:2504.20147] [Google Scholar]
- Amaro-Seoane, P., Audley, H., Babak, S., et al. 2017, Laser Interferometer Space Antenna (ESA PUBLICATIONS DIVISION C/O ESTEC) [Google Scholar]
- Amaro Seoane, P., Lin, Y., & Tzanavaris, K. 2024, Phys. Rev. D, 110, 064011 [Google Scholar]
- Amaro Seoane, P., Arnau, J. V., & Alfonso, M. J. F. i 2025, arXiv e-prints [arXiv:2504.10594] [Google Scholar]
- Astropy Collaboration (Robitaille, T. P., et al.) 2013, A&A, 558, A33 [NASA ADS] [CrossRef] [EDP Sciences] [Google Scholar]
- Astropy Collaboration (Price-Whelan, A. M., et al.) 2018, AJ, 156, 123 [Google Scholar]
- Astropy Collaboration (Price-Whelan, A. M., et al.) 2022, ApJ, 935, 167 [NASA ADS] [CrossRef] [Google Scholar]
- Bahcall, J. N., & Wolf, R. A. 1976, ApJ, 209, 214 [NASA ADS] [CrossRef] [Google Scholar]
- Bahcall, J. N., & Wolf, R. A. 1977, ApJ, 216, 883 [NASA ADS] [CrossRef] [Google Scholar]
- Capuzzo-Dolcetta, R., & Sadun-Bordoni, M. 2023, MNRAS, 522, 5828 [NASA ADS] [CrossRef] [Google Scholar]
- Chassonnery, P., & Capuzzo-Dolcetta, R. 2021, MNRAS, 504, 3909 [NASA ADS] [CrossRef] [Google Scholar]
- Chassonnery, P., Capuzzo-Dolcetta, R., & Mikkola, S. 2019, arXiv e-prints [arXiv:1910.05202] [Google Scholar]
- Davies, R., Alves, J., Clénet, F., et al. 2018, SPIE Conf. Ser., 10702, 107021S [NASA ADS] [Google Scholar]
- Frank, J., & Rees, M. J. 1976, MNRAS, 176, 633 [NASA ADS] [CrossRef] [Google Scholar]
- Freitag, M., Amaro-Seoane, P., & Kalogera, V. 2006, ApJ, 649, 91 [NASA ADS] [CrossRef] [Google Scholar]
- Ghez, A. M., Duchêne, G., Matthews, K., et al. 2003, ApJ, 586, L127 [Google Scholar]
- Ghez, A. M., Salim, S., Weinberg, N. N., et al. 2008, ApJ, 689, 1044 [Google Scholar]
- Gillessen, S., Plewa, P. M., Eisenhauer, F., et al. 2017, ApJ, 837, 30 [Google Scholar]
- GRAVITY Collaboration 2017, A&A, 602, A94 [NASA ADS] [CrossRef] [EDP Sciences] [Google Scholar]
- GRAVITY Collaboration 2018, A&A, 615, L15 [NASA ADS] [CrossRef] [EDP Sciences] [Google Scholar]
- GRAVITY Collaboration 2019, A&A, 625, L10 [NASA ADS] [CrossRef] [EDP Sciences] [Google Scholar]
- GRAVITY Collaboration 2020, A&A, 636, L5 [NASA ADS] [CrossRef] [EDP Sciences] [Google Scholar]
- GRAVITY+ Collaboration 2022, The Messenger, 189, 17 [NASA ADS] [Google Scholar]
- GRAVITY Collaboration 2022, A&A, 657, L12 [NASA ADS] [CrossRef] [Google Scholar]
- GRAVITY Collaboration 2023, A&A, 672, A63 [NASA ADS] [CrossRef] [EDP Sciences] [Google Scholar]
- GRAVITY Collaboration 2024, A&A, 692, A242 [NASA ADS] [CrossRef] [EDP Sciences] [Google Scholar]
- Harris, C. R., Millman, K. J., van der Walt, S. J., et al. 2020, Nature, 585, 357 [NASA ADS] [CrossRef] [Google Scholar]
- Hintze, J. L., & Nelson, R. D. 1998, Am. Stat., 52, 181 [CrossRef] [Google Scholar]
- Hunter, J. D. 2007, Comp. Sci. Eng., 9, 90 [NASA ADS] [CrossRef] [Google Scholar]
- Kluyver, T., Ragan-Kelley, B., Pérez, F., et al. 2016, in IOS Press, Positioning and Power in Academic Publishing: Players, Agents and Agendas, eds. F. Loizides and B. Schmidt, 87 [Google Scholar]
- Merritt, D., Berczik, P., & Laun, F. 2007, AJ , 133, 553 [NASA ADS] [CrossRef] [Google Scholar]
- Merritt, D., Alexander, T., Mikkola, S., et al. 2010, Physical Review D, 81, 062002 [Google Scholar]
- Mikkola, S., & Tanikawa, K. 1999a, MNRAS, 310, 745 [Google Scholar]
- Mikkola, S., & Tanikawa, K. 1999b, Celest. Mech. Dyn. Astron., 74, 287 [Google Scholar]
- Mora, T., & Will, C. M. 2004, Phys. Rev. D, 69, 104021 [CrossRef] [Google Scholar]
- Peebles, P. J. E. 1972, ApJ, 178, 371 [NASA ADS] [CrossRef] [Google Scholar]
- Preto, M., & Amaro-Seoane, P. 2010, ApJ, 708, L42 [NASA ADS] [CrossRef] [Google Scholar]
- Reid, M. J., & Brunthaler, A. 2020, ApJ, 892, 39 [Google Scholar]
- Rein, H., & Liu, S. F. 2012, A&A, 537, A128 [NASA ADS] [CrossRef] [EDP Sciences] [Google Scholar]
- Rein, H., & Spiegel, D. S. 2015, MNRAS, 446, 1424 [Google Scholar]
- Sabha, N., Eckart, A., Merritt, D., et al. 2012, A&A, 545, A70 [NASA ADS] [CrossRef] [EDP Sciences] [Google Scholar]
- Schödel, R., Ott, T., Genzel, R., et al. 2002, Nature, 419, 694 [Google Scholar]
- Tamayo, D., Rein, H., Shi, P., & Hernandez, D. M. 2020, MNRAS, 491, 2885 [NASA ADS] [CrossRef] [Google Scholar]
- Virtanen, P., Gommers, R., Oliphant, T. E., et al. 2020, Nat. Methods, 17, 261 [Google Scholar]
- Waisberg, I., Dexter, J., Gillessen, S., et al. 2018, MNRAS, 476, 3600 [NASA ADS] [CrossRef] [Google Scholar]
- Wes McKinney 2010, in Proceedings of the 9th Python in Science Conference, eds. Stéfan van der Walt & Jarrod Millman, 56 [Google Scholar]
- Will, C. M. 1993, Theory and Experiment in Gravitational Physics (Cambridge: Cambridge University Press) [Google Scholar]
- Will, C. M. 2014, Liv. Rev. Relativ., 17, 4 [Google Scholar]
- Will, C. M., Naoz, S., Hees, A., et al. 2023, ApJ, 959, 58 [NASA ADS] [CrossRef] [Google Scholar]
- Zhang, F., & Amaro-Seoane, P. 2024, ApJ, 961, 232 [NASA ADS] [CrossRef] [Google Scholar]
- Zhang, F., & Iorio, L. 2017, ApJ, 834, 198 [NASA ADS] [CrossRef] [Google Scholar]
The Kullback-Leibler divergence with N1 = 50 and N2 = 100 realizations is Dkl(N11N2) ≲ 0.05.
Macbook Pro M1, using a single core.
All Tables
Median values of δϕxy and ⟨θ⟩ (in arcminutes) obtained for different choices of Me,S2 and m.
All Figures
|
Fig. 1 Left: S2 orbit (in blue) around Sgr A* (marked by a red cross) and a particular realization (black dots) of the distribution of the surrounding cluster particles, as described in Section 2.1. The total mass in cluster particles enclosed within the apocenter distance of S2, ra,S2 (in green), is denoted as Me,S2. The particles are sampled up to a distance 2 × ra,S2 (in orange). Right: flowchart describing the analysis procedure. |
| In the text | |
|
Fig. 2 Deviation from spherical symmetry as a function of time, quantified by ∆f (see Section 2.2) and shown in blue for one arbitrarily chosen simulation of the S2 orbit in presence of a cluster of 200 objects of 10 M⊙ each. The force ratio, F, is shown in purple (see Section 2.2). |
| In the text | |
|
Fig. 3 Violin plots showing the in-plane angular precession (left panel) and the average orbital plane precession (right panel) as a function of the mass of the cluster objects, for Me,S2 = 100M⊙ (green) and Me,S2 = 1000M⊙ (blue). The dots show the median value of the distributions, the vertical segments indicate the breadth of the distributions, going from the 5th to the 95th percentile in case of the in-plane precession and from the minimum value to the 90th percentile in case of the orbital plane precession. |
| In the text | |
|
Fig. 4 Cumulative distribution functions (CDFs) of the average (over a radial period) of the ratio fi/fS grA*, between the norm of the force exerted on S2 by each cluster object and that due to Sgr A*. Here, Me,S2 is set to 1500 M⊙ and m is varied as indicated in the figure. Larger values of m lead to stronger interactions on average between S2 and the cluster particles. |
| In the text | |
|
Fig. 5 Violin plots comparing the results obtained with the simplified approach (in blue) and the full N-body code (in red). The plots display the in-plane precession (left panel) and the average precession of the orbital plane (right panel) of S2 over one radial period, as a function of the mass of the cluster objects. The dots show the median value of the distributions, while the vertical segments indicate the breadth of the distributions, going from the 5th to the 95th percentile for the in-plane precession and from the minimum value to the 90th percentile for the orbital plane precession. |
| In the text | |
|
Fig. 6 Violin plots of the best-fit fsp (left) and Me,S2 (right) obtained through a mock data analysis. Results from the simplified approach are shown in blue, while those from the full N-body simulations are shown in red. |
| In the text | |
|
Fig. 7 Residuals in Dec (first row), RA (second row), and radial velocity (third row) as functions of time, between the 100 simulated orbits in the granular case (full N-body simulations) and the respective best-fit Schwarzschild orbits (fSP = 1). The first column gives the results considering a population of 20 M⊙ black holes, the second column 50 M⊙ black holes, the third 100 M⊙ black holes. Each of the 100 residual curves is shown in light grey, highlighting their median (solid black line), 68th percentile (red filled area), and 90th percentile (blue filled area). |
| In the text | |
Current usage metrics show cumulative count of Article Views (full-text article views including HTML views, PDF and ePub downloads, according to the available data) and Abstracts Views on Vision4Press platform.
Data correspond to usage on the plateform after 2015. The current usage metrics is available 48-96 hours after online publication and is updated daily on week days.
Initial download of the metrics may take a while.