Fig. 5
Download original image
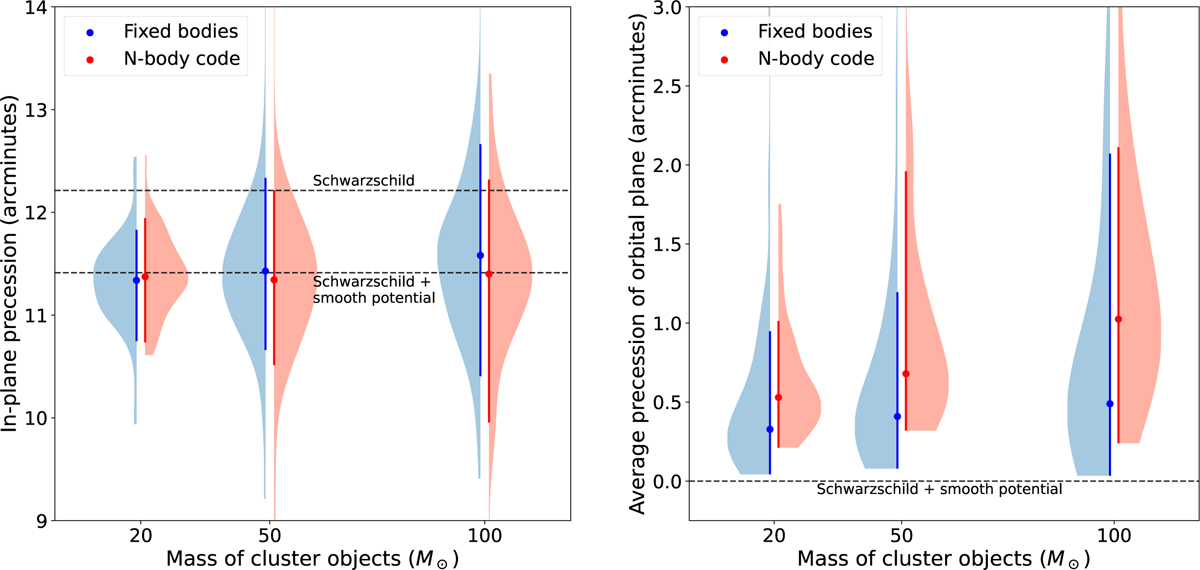
Violin plots comparing the results obtained with the simplified approach (in blue) and the full N-body code (in red). The plots display the in-plane precession (left panel) and the average precession of the orbital plane (right panel) of S2 over one radial period, as a function of the mass of the cluster objects. The dots show the median value of the distributions, while the vertical segments indicate the breadth of the distributions, going from the 5th to the 95th percentile for the in-plane precession and from the minimum value to the 90th percentile for the orbital plane precession.
Current usage metrics show cumulative count of Article Views (full-text article views including HTML views, PDF and ePub downloads, according to the available data) and Abstracts Views on Vision4Press platform.
Data correspond to usage on the plateform after 2015. The current usage metrics is available 48-96 hours after online publication and is updated daily on week days.
Initial download of the metrics may take a while.