Fig. 7
Download original image
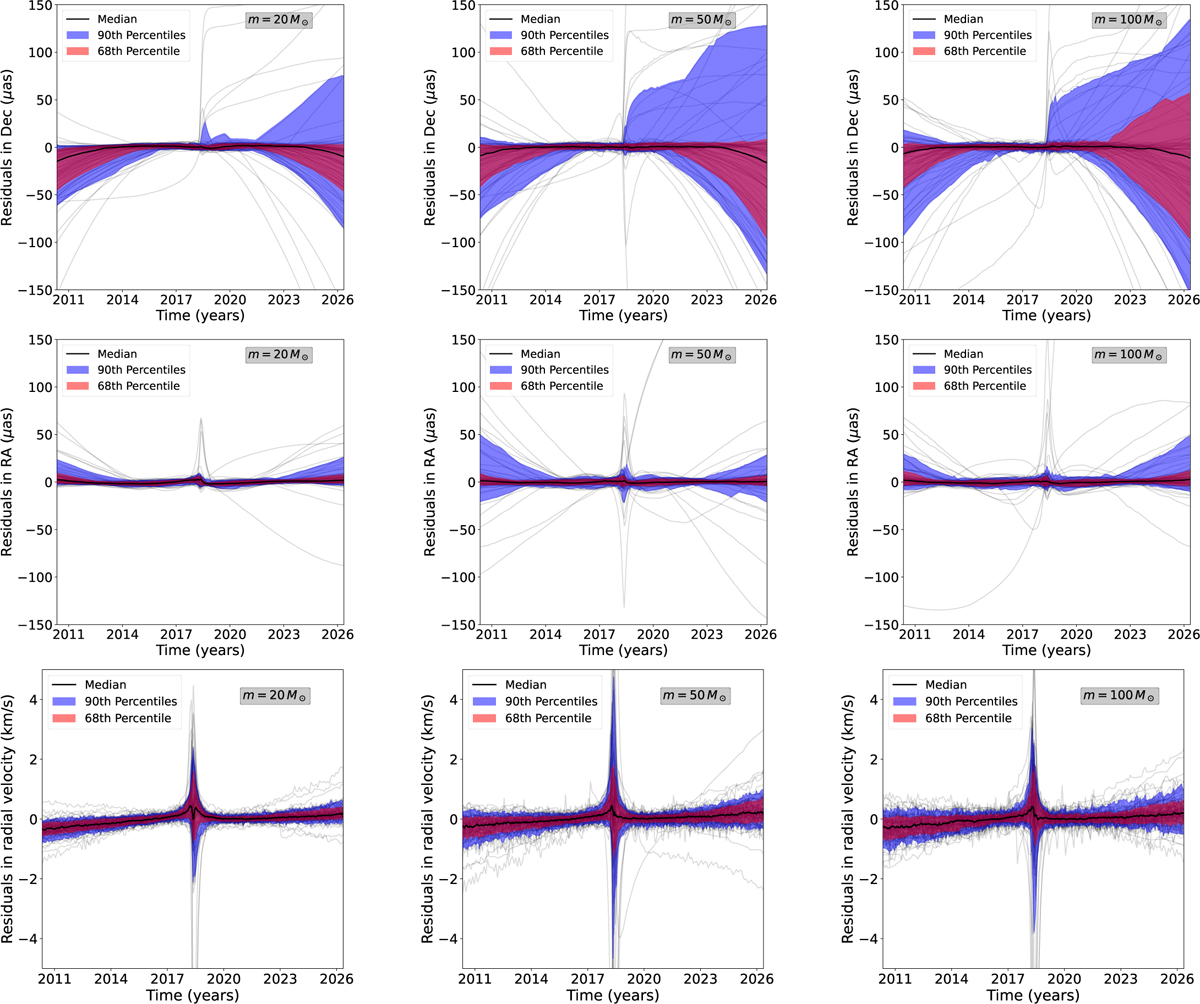
Residuals in Dec (first row), RA (second row), and radial velocity (third row) as functions of time, between the 100 simulated orbits in the granular case (full N-body simulations) and the respective best-fit Schwarzschild orbits (fSP = 1). The first column gives the results considering a population of 20 M⊙ black holes, the second column 50 M⊙ black holes, the third 100 M⊙ black holes. Each of the 100 residual curves is shown in light grey, highlighting their median (solid black line), 68th percentile (red filled area), and 90th percentile (blue filled area).
Current usage metrics show cumulative count of Article Views (full-text article views including HTML views, PDF and ePub downloads, according to the available data) and Abstracts Views on Vision4Press platform.
Data correspond to usage on the plateform after 2015. The current usage metrics is available 48-96 hours after online publication and is updated daily on week days.
Initial download of the metrics may take a while.