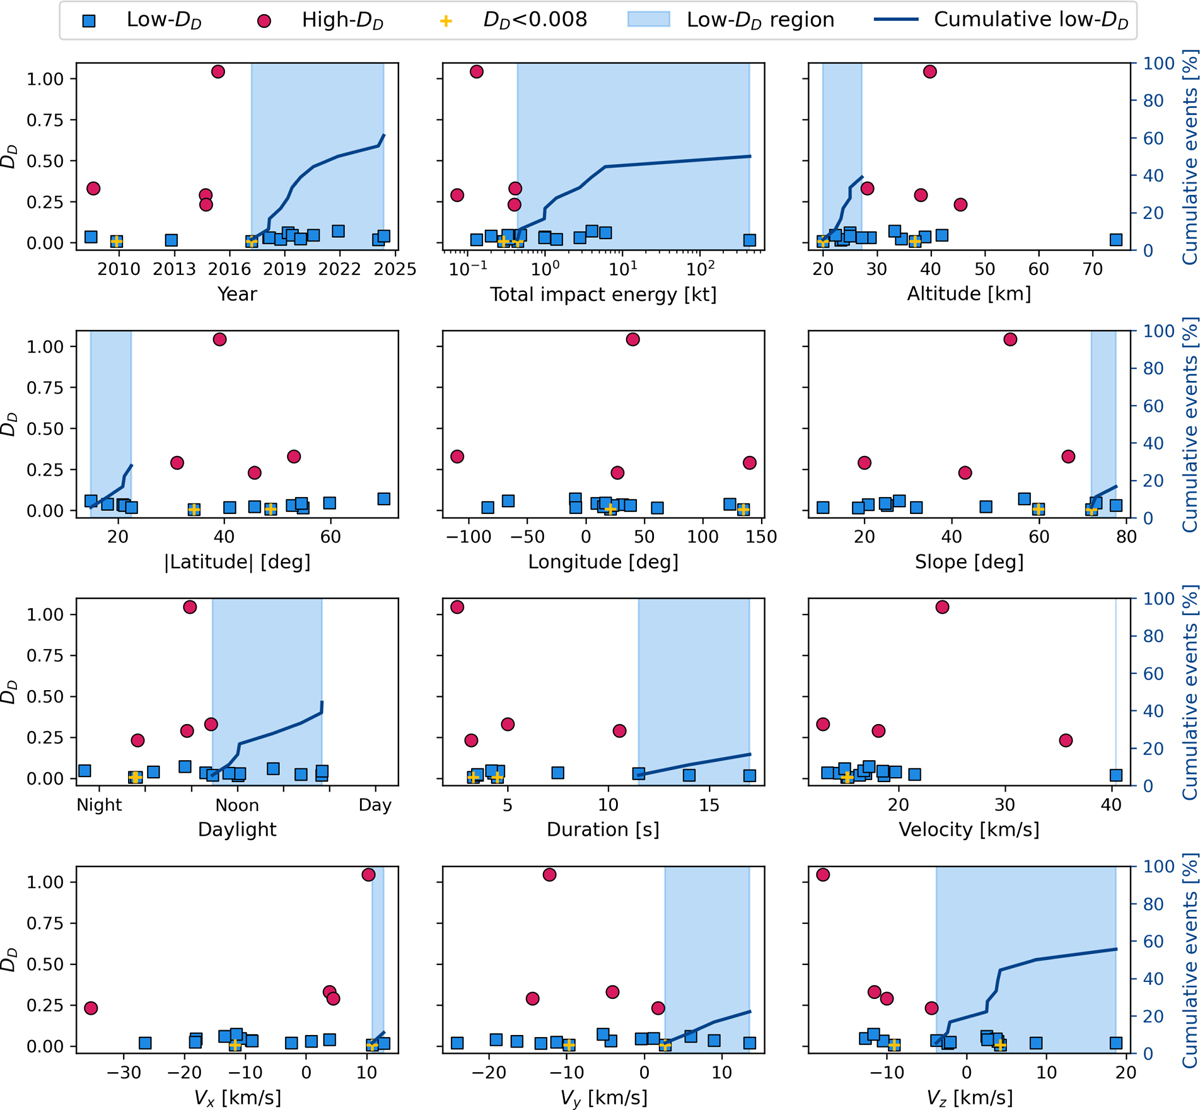
Fig. 2
Download original image
Discriminants identified with the statistical test. First-row panels: date (left), energy (center), and altitude (right). Second-row panels: absolute latitude (left), longitude (center), atmospheric entry angle (right). Third-row panels: Daylight (left), duration (center), and velocity (right). Fourth-row panels: x-velocity component (left), y-velocity component (center), and z-velocity component (right). The filled light blue region represents consecutive low-DD events, while the solid line depicts their cumulative percentage, offering a visual indication of the discriminant’s effectiveness. Fireballs flagged as low-DD(DD < 0.1) are denoted by blue squares and high-DD(DD > 0.1) with red circles. Fireballs with DD < 0.008 have a yellow plus symbol.
Current usage metrics show cumulative count of Article Views (full-text article views including HTML views, PDF and ePub downloads, according to the available data) and Abstracts Views on Vision4Press platform.
Data correspond to usage on the plateform after 2015. The current usage metrics is available 48-96 hours after online publication and is updated daily on week days.
Initial download of the metrics may take a while.